I am receiving numerous reports of wheat and barley fields that were severely injured by cold temperatures. The symptoms are completely or mostly blank/absent kernels on entire heads. What I had seen prior to this week manifested as a few missing kernels on the head, or scattered white heads that were obvious freeze injury. These newly symptomatic fields either seem normal or just slightly ‘off’ from the road but on investigation many heads have no grain. In some cases, the stems are beginning to turn brown and die. At this point I think this is in a few local areas and not widespread. It was obviously a combination of low temps and particular fields that were at a very susceptible stage.
I encourage you to assess small grain fields. Any damage is much less severe near edges, roads or lanes, so scout well out into fields. Those with severe damage should contact their crop insurance adjuster or VCE agent ASAP to assess the yield potential in the field.
Author Archives: Wade Thomason
Potential for cold damage to small grain and corn
I’m sure this weekend’s forecast is generating some questions about the potential for frost/freeze injury.
First, let’s deal with corn. I don’t think any parts of our state are forecast to be cold enough to kill any young corn plants. Air temps would have to fall below 28 degrees or so for several hours for there to be a danger of plant death. What’s a lot more likely is that we get 32-35 with no wind and get a significant frost. For corn that is emerged, this may well result in death of those frosted leaves. While this will set the crop back, it should not harm the stand and plants should recover. After about three days, the growing points of plants can be examined for injury. Green, healthy tissue is a sign that plants will recover.
Purdue University has a good, brief summary with photos.
https://www.agry.purdue.edu/ext/corn/news/timeless/FrostedCorn.html
Based on the cool weather and rainfall, I have been expecting to see lots of nitrogen, sulfur and zinc deficiency early in this year’s crop anyway. Cold injury may exacerbate this and bring those symptoms on even earlier. If deficiency symptoms do appear, an earlier than normal sidedress application may be needed this year.
Wheat is also a concern. The best resource that I know of on the subject comes from Kansas State. https://www.sunflower.k-state.edu/agronomy/docs/c646_Whole_Wheat_Freeze_Publication.pdf
Table 1 from that publication and shows that temperatures around 30 degrees can definitely cause damage to our crop based on the growth stage of many fields. But note that these expectations for injury are from two hours of exposure to that temperature, not just a few minutes.
Like with corn, it will take 3-5 days after the event to assess the damage so I would encourage you and your growers to scout for injury next week.
2017 Virginia Tech Small Grain Variety performance results
The 2017 Virginia Tech Small Grain Variety performance results have been posted.
A copy of the document is available at the following link:
http://www.grains.cses.vt.edu/Testing_results/Small_grains/2017/SG_17_2.pdf
Why is my late-planted 110 day RM maturing in 100 days (or less) this year?
Recent observations from around the state have found corn maturing at a fast pace this year, especially corn that was planted late. The most commonly used method for assigning corn hybrid maturity ratings is based on Days to Maturity. This typically indicates the number of days it would take a corn hybrid to reach physiological maturity or “black layer”. But temperature drives corn development, not calendar days. So the “thermal time” to maturity calculated using growing degree days (GDD) is a more accurate measure. Especially when the growing season has been particularly warmer or cooler than normal.
The chart below shows the difference in cumulative GDD between 2016 and the 30 year mean temperatures beginning on JUNE 1.
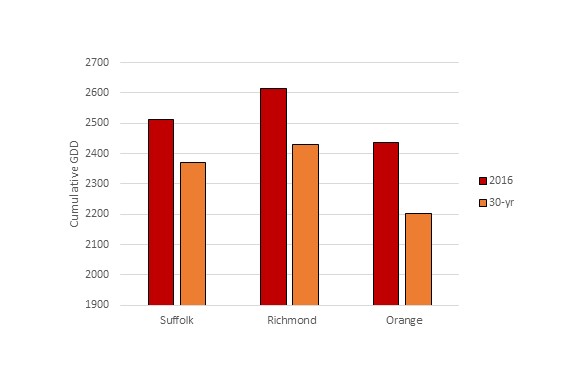
We are 6, 7, and 10% above the “normal” GDD accumulation for August 31 at Suffolk, Richmond, and Orange, respectively.
This might explain why a 110 day RM corn is maturing more quickly than expected based on the “day” count. The plant has actually accumulated heat units at a faster rate this year.
If May 1 is the starting point, we are 3, 4, and 7% above the “normal” GDD accumulation for these sites. So this effect is likely to seem greater in later planted corn.
Initial results from the 2016 Virginia state wheat and barley tests are available in excel format at:
The full document and summary is coming soon.
2016 Wheat and Growing Degree Day Accumulation
Previous work in VA has demonstrated that we “normally” accumulate around 1350 GDD from planting to jointing in wheat in Virginia. The warm weather this year has been anything but normal and so I don’t think we can follow that guidepost this time.
Our wheat varieties require at least 30 days of temps less than about 42 degrees to vernalize. In most areas we made that threshold of at least 30 days between what I considered to be a normal planting date for the region and the end of the year. For example near Richmond a crop with planting date of Oct 20 would have experienced 31 days with lows below 42F before January 1. Other researchers have reported that wheat requires around 700 GDD after the vernalization threshold has been reached. This seems pretty reasonable for use in VA. When comparing to the 30 year average temperatures for central VA, 700 GDD accumulated from January 1 predicts a jointing date of March 20. I believe this matches well with historical observations for the crop
Below is a figure showing GDD accumulated at 3 sites in eastern VA since January 1, 2016.
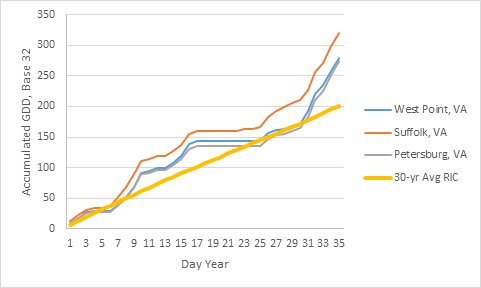
Yep – it’s been warm. About 40% greater GDD accumulation at this point in the year compared to the long term average. Normally we are accumulating about 5.75 GDD/day this time year. This year it’s over 8.
I honestly don’t what this means for us in terms of wheat development.
If the temperatures return to the 30 year average tomorrow the warm weather thus far would have relatively little impact. Instead of predicting a jointing date of March 20 (700 GDD) we would get to 700 GDD on about March 15.
The 14-day forecast I’m looking at has us continuing to stay warmer, however.
If we stay near the current trend through jointing, it’s possible we will be 3 weeks ahead of the long term average.
I won’t pretend to be able to forecast the coming weather, but I think it’s likely that things may begin to happen very quickly with the crop.
This may impact our ability to split N applications as driving over wheat that’s already jointed damages the growing point. I suspect weeds, insects, and disease are also responding to these warmer temperatures. Small weeds are going to get to be big weeds sooner this year. Diseases like powdery mildew have already been found in the crop in some places. Scouting early and often may prove a valuable investment.
Wheat seeding rate and drill calibration, 2015-16
Based on previous research we know we need at least 70-80 heads per square foot to reach optimum wheat yields. That typically requires a seeding rate of 30-35 seeds per square foot, which is equivalent to 20-22 seeds per foot of row in 7.5 inch rows. The reason we advise seeding based on actual number of seeds per seed lot, and not on a pound per acre basis is that seed size varies considerably among wheat varieties and over years for the same variety. The number of seeds per pound is determined both by genetics and by environment. A few of the entries in our state wheat variety test are listed below and it’s obvious that a range of 30% or larger exists among varieties within a year. The consequence of not calibrating grain drills to deliver the optimum seeding rate can vary. If too little seed is planted, yield potential may be compromised. Overseeding increases seeding cost and in a year with smaller profit margins in wheat, we certainly need to avoid both. This management activity is an investment of time, but spending that time can result in greater profit.
|
2016 |
2015 |
2014 |
Mean |
% Dev. |
|
|
———–seed/lb———– |
|||||
| Massey |
13046 |
12371 |
10318 |
11912 |
23% |
| Jamestown |
13472 |
14277 |
11762 |
13170 |
19% |
| Shirley |
11100 |
10861 |
9722 |
10561 |
13% |
| Pioneer Brand 26R20 |
12825 |
14157 |
11378 |
12787 |
22% |
| Pioneer Brand 25R32 |
13593 |
13488 |
13353 |
13478 |
2% |
| Featherstone 73 |
14099 |
12304 |
11436 |
12613 |
21% |
| VA10W-119 |
10993 |
11756 |
9578 |
10775 |
20% |
| Pioneer Brand 26R10 |
10509 |
12587 |
11073 |
11390 |
18% |
| Pioneer Brand 26R41 |
11979 |
10682 |
10913 |
11192 |
12% |
| Pioneer Brand 26R53 |
11671 |
11988 |
11947 |
11869 |
3% |
| Avg. by year | 12329 | 12447 | 11148 | 11975 | |
Preliminary 2015 Hulled and Hulless Barley OVT results posted
The 2015 barley OVT trial data have been posted to the Corn and Small Grain Management website. By-location, 2015, two and three year data are summarized in Excel format. The links can be found on the website:
http://www.grains.cses.vt.edu/
Or by using these direct links to the excel files.
http://www.grains.cses.vt.edu/Testing_results/barleytables2015.xlsx
http://www.grains.cses.vt.edu/Testing_results/hullesstables2015.xlsx
2015 Virginia Barley Yield Contest now OPEN!
2015 Virginia Barley Yield Contest now OPEN!
The 2015 Virginia Barley Yield Contest is open for entries. The contest is conducted by the Virginia Grain Producers Association and Virginia Cooperative Extension. Prizes are sponsored by the Virginia Crop Improvement Association. All entrants must be members of the Virginia Grain Producers Association.
Contest rules and entry form can be found here:
http://www.grains.cses.vt.edu/links/Yield_contest/2015%20barley%20yield%20contest%20rules.docx
or: