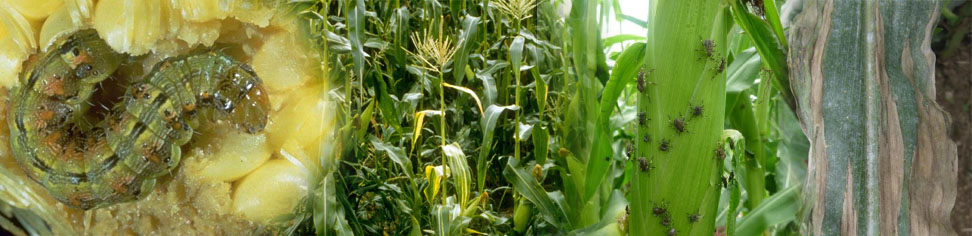
Twenty-three representative cotton fields in eight Virginia counties were scouted weekly for plant bug abundance and square retention. Data for the June 28th through July 13th sampling period is represented in the distribution map below (follow link to view). We will continue to post updates to the map through peak plant bug abundance in cotton. Sweep net and drop cloth samples were taken for each field to account for sampling bias associated with sweep net sampling towards adult captures and drop cloth sampling towards nymphal captures. When sampling cotton fields for plant bugs, look carefully for nymphs (pictured below). Since nymphs are flightless, they may spend more time feeding in an isolated area and cause more damage than adults because their movement in and out of fields is limited. The action threshold for plant bug in Mid-Atlantic cotton is generally eight plant bugs (i.e., adults and nymphs) per 100 sweeps in addition to square retention below 80 percent.
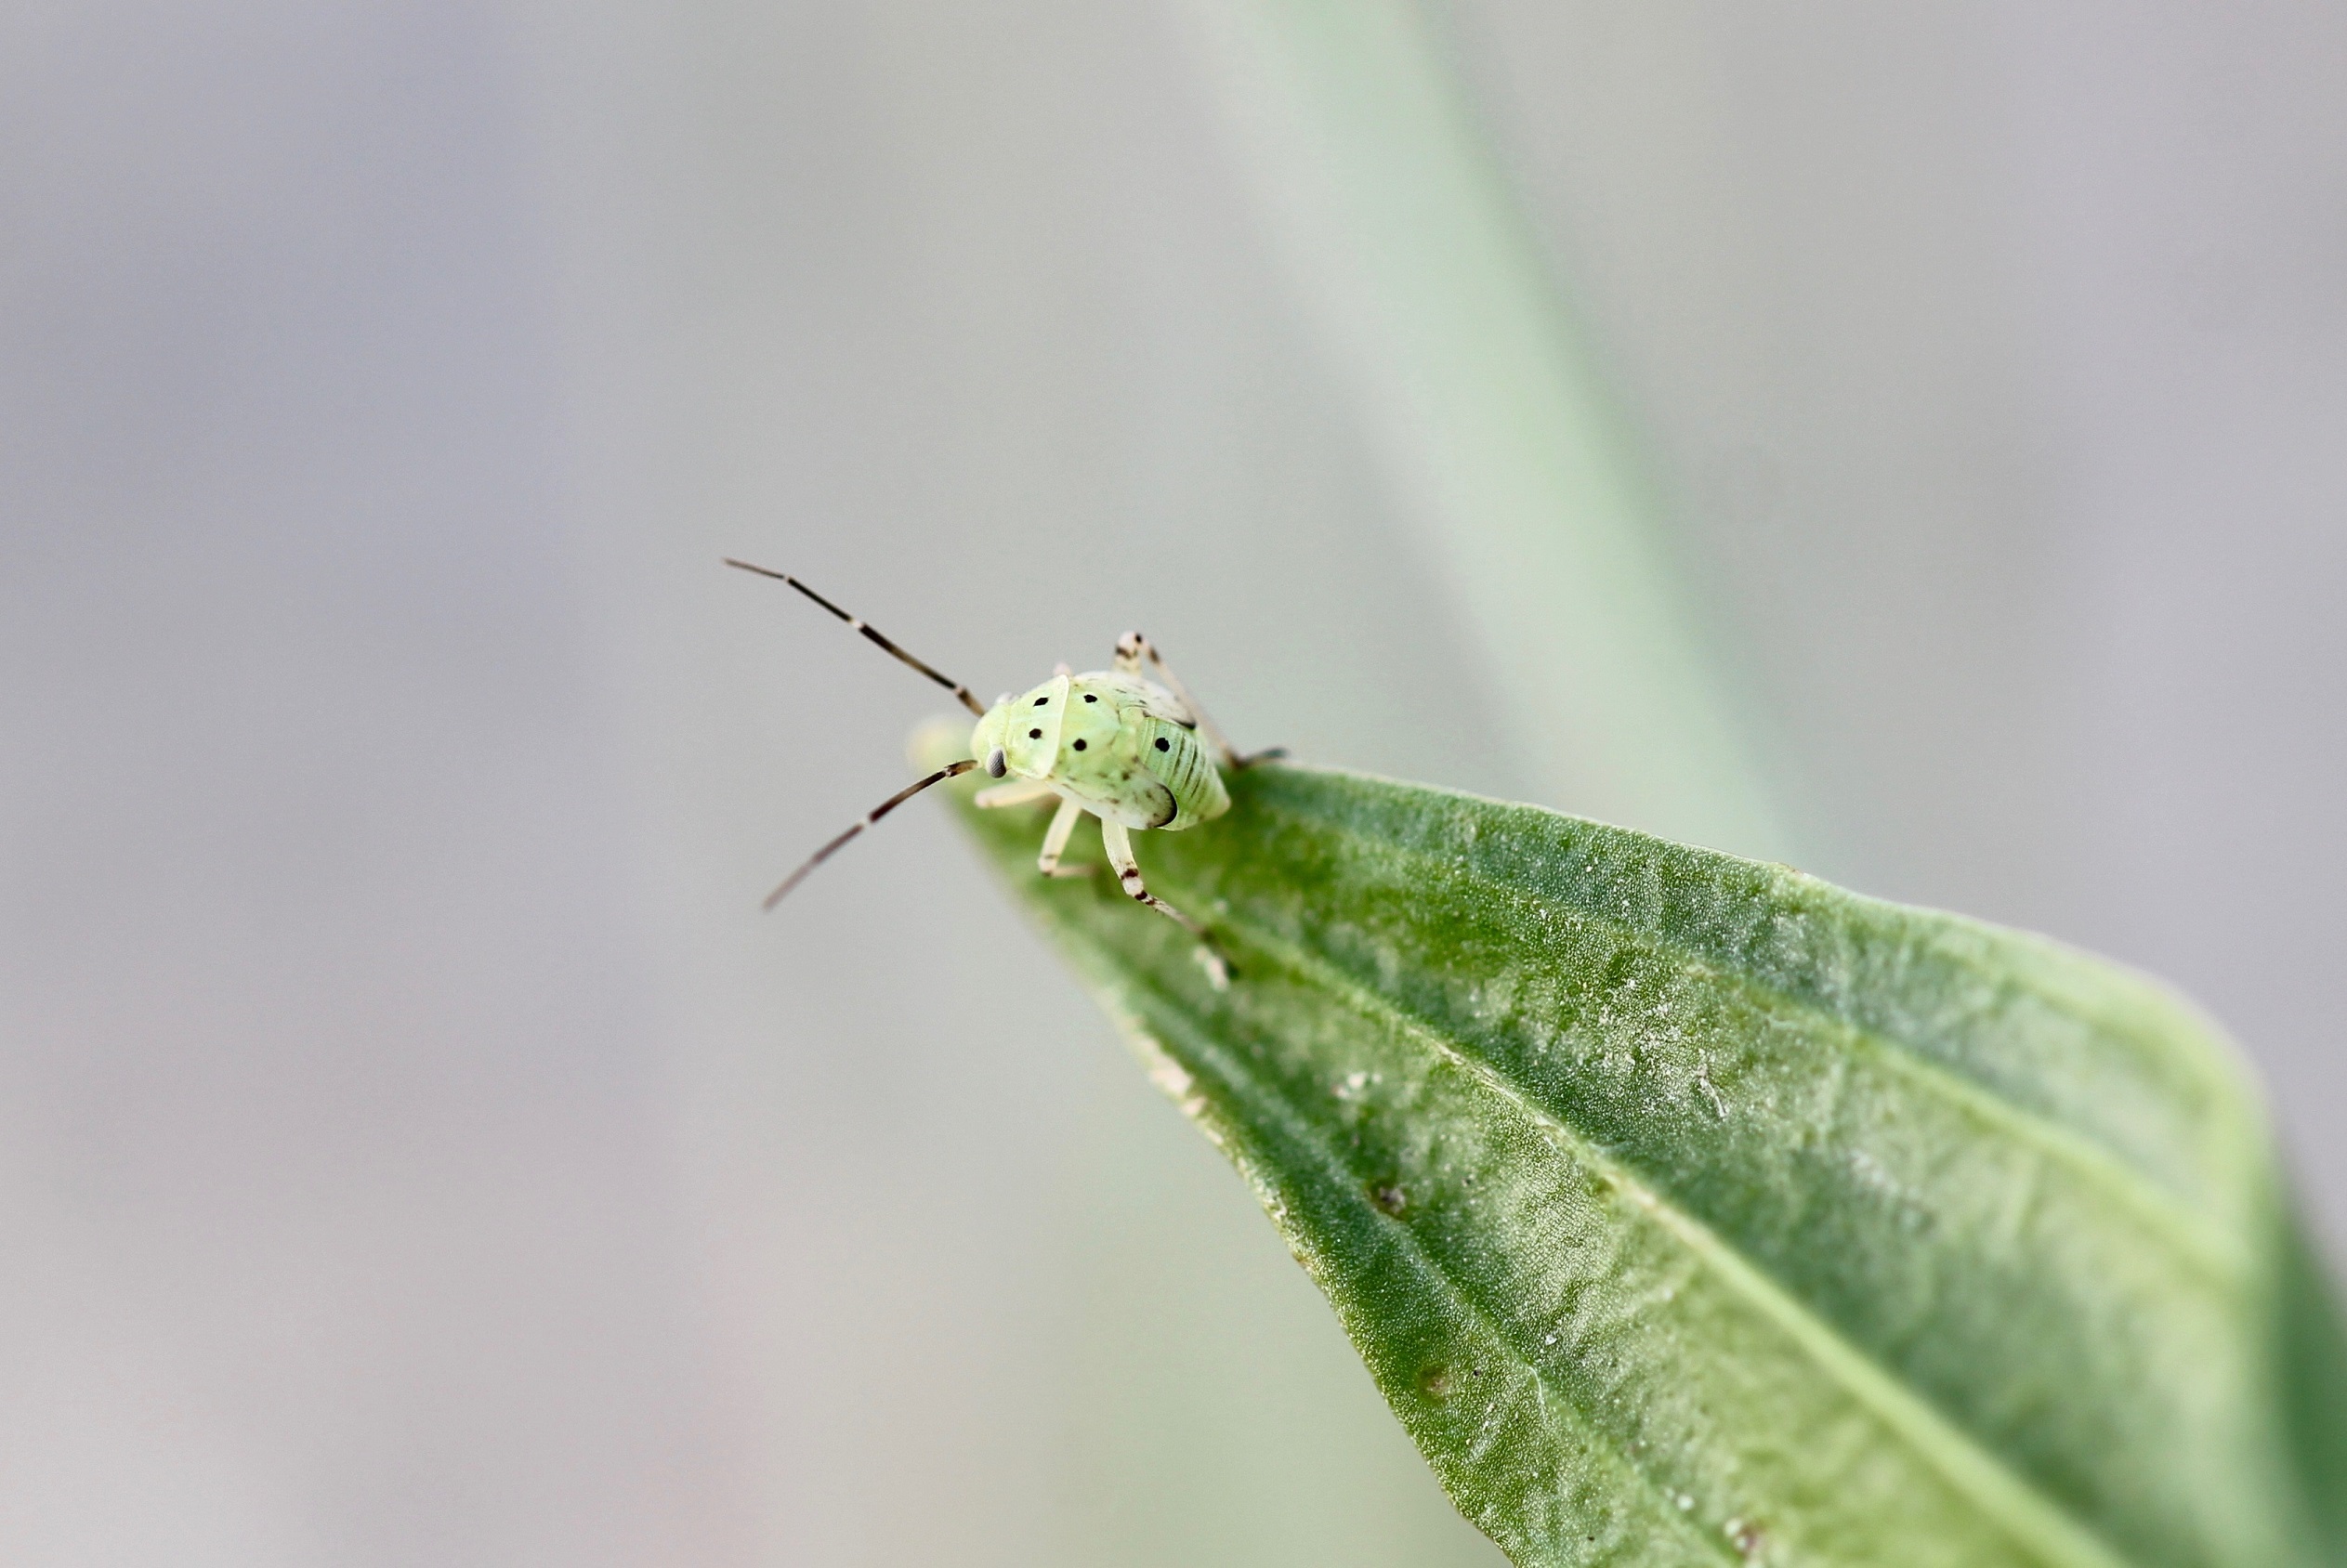
Plant bug nymph feeding on weedy host, buckhorn plantain (Plantago lanceolata).
When viewing the distribution map in full-screen mode, click on the left arrow icon to view map legend. Click on sampling labels on the map to view square retention and number of samples taken from each site. Mean plant bug densities were calculated by sampling four sweet net samples (25 sweeps per sample) and four drop cloth samples across each field. Total adults and nymphs in a single visit were totaled and averaged for each visit within the sampling period.
Click here to view full-screen distribution map
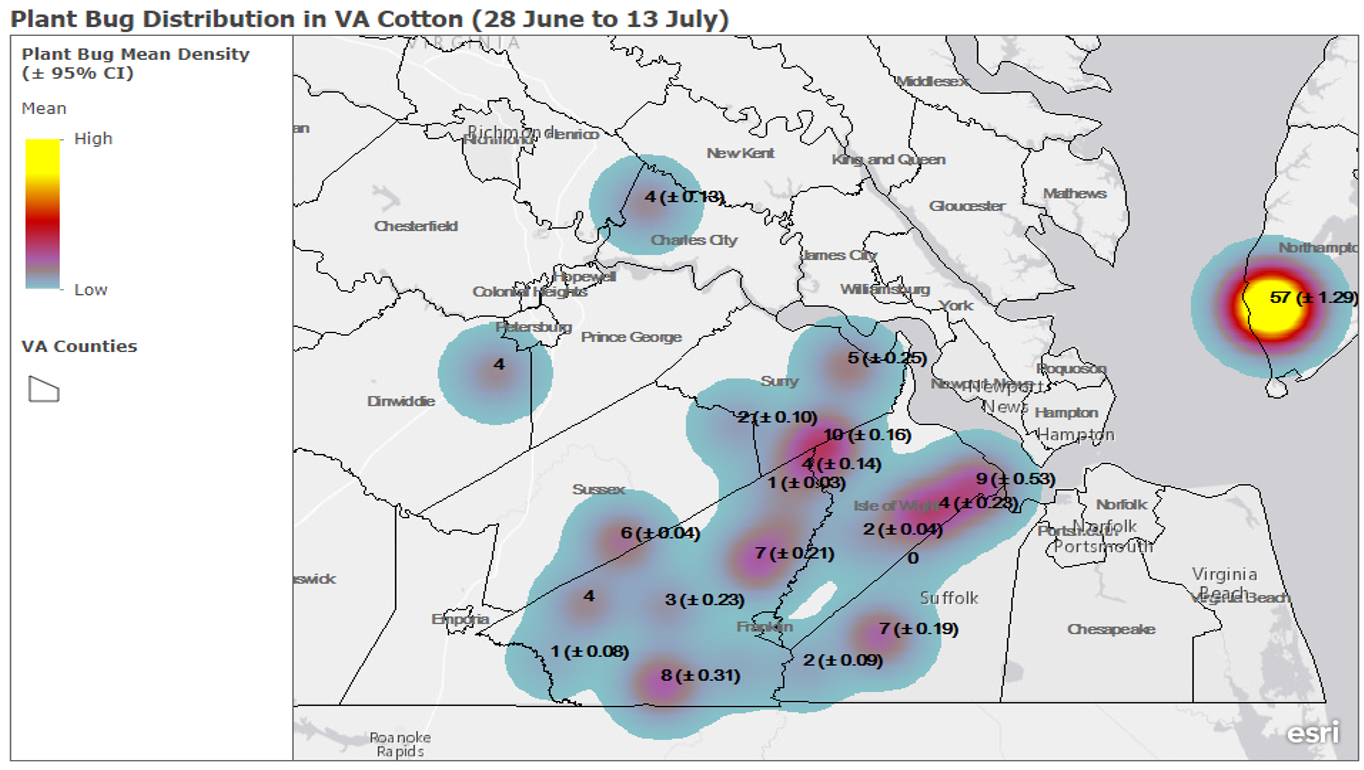
Plant bug distribution map in Virginia cotton sampled from 28 June to 13 July 2017.