The following advisory is from Dr. Hunter Frame: Excess rains and leaching of nitrogen
Category Archives: Commodity
Kudzu Bug Overwintering Emergence and Predictions for the Coming Season
Please see the attached report (pdf document) by Dr. Herbert: Kudzu_bug_prediction
Peanut Disease Update
Recent warm, wet weather has been optimal for both plant growth and fungal disease development in peanut and other crops. Early planted peanut in southeastern Virginia is near the R3 (beginning pod) stage, so it is almost time to make the first fungicide application for leaf spot. The first spray can be delayed until two weeks after R3 on Bailey. Last effective spray dates for leaf spot can be found on the Virginia Peanut-Cotton Infonet website.
Sclerotinia blight risk in based on temperature, rainfall/humidity, and crop growth. Temperature and rainfall have been conducive for Sclerotinia blight, but Sclerotinia risk is considered low to moderate prior to canopy closure. However, rapid growth of the peanut crop in some fields has resulted in thick canopies that provide the moist micro-climate necessary for disease development. Thus, now is the time to start scouting for Sclerotinia blight in peanut fields, especially if vines are within six inches of touching. If the wet weather continues, Sclerotinia blight risk is expected to be high within the next couple of weeks.
Corn Disease Update
Recent warm, wet weather has favored development of foliar diseases in corn and other crops. Northern corn leaf blight has been confirmed in southeastern Virginia over the past week, and gray leaf spot has been observed on corn in the region. Corn in much of the state is at or just beyond tasseling, and it is not too late to consider a foliar fungicide application. Several factors increase the risk of corn yield loss to foliar diseases and the chances that application of a fungicide will be profitable.
- Susceptibility of corn hybrid to disease. Varieties have a high turnover rate so check with your local extension office or seed dealer for current information on which varieties have some level of resistance to diseases in the region. Be aware of the specific diseases your hybrid is susceptible or resistant to.
- Yield potential. If yield potential is low, you do not have much to gain and fungicide applications are less likely to be profitable.
- Previous crop and cropping system (e.g. no till). Many pathogens are able to survive on crop residues. Keep in mind that some diseases overwinter on crop debris in Virginia (e.g. gray leaf spot) whereas others require a living plant host and must move in from warmer regions each year (e.g. southern corn rust).
- Crop growth stage and timing of fungicide applications. Diseases are more likely to impact yield at particular growth stages of the crop (typically during development of the grain) so timing fungicide applications accordingly is key.
- Disease pressure. Which diseases, if any, are present, and how widespread are they? Scouting and accurate pathogen/pest identification are critical components of any IPM program. Presence of a disease on lower leaves (2nd or 3rd leaf below the ear) at or near tasseling may indicate the need for a fungicide application. Yield loss can occur if diseases reach the ear leaf prior to grain fill, but the appearance of foliar disease following the dent stage is unlikely to impact yield. A “Corn Disease Scouting and Fungicide Guide” can be downloaded below.
- Weather. Temperature and humidity greatly influence the onset and development of disease. Even if the crop is susceptible and a pathogen is present, the risk of yield loss to disease may be low if environmental conditions are not conducive pathogen growth and reproduction. Warm, humid conditions are favorable for many diseases in our region. In some cases, the micro-climate within a field may be conducive for disease development even when ambient conditions are relatively dry, especially when high plant populations and a dense canopy are present in a field.
Corn Disease Scouting & Fungicide Guide
Preliminary 2015 Hulled and Hulless Barley OVT results posted
The 2015 barley OVT trial data have been posted to the Corn and Small Grain Management website. By-location, 2015, two and three year data are summarized in Excel format. The links can be found on the website:
http://www.grains.cses.vt.edu/
Or by using these direct links to the excel files.
http://www.grains.cses.vt.edu/Testing_results/barleytables2015.xlsx
http://www.grains.cses.vt.edu/Testing_results/hullesstables2015.xlsx
Corn earworm and BMSB black light trap report for week ending July 2, 2015
Thanks to Austin Brown, Mary Beahm, and Ames Herbert & crew for their reports this week. Corn earworm moth nightly average black light trap catches were: Warsaw-zero; Suffolk-2.1; Southampton (Courtland): zero. Brown marmorated stink bug black light trap catches (nightly averages) were Warsaw-zero; Suffolk-zero; Southampton (Courtland)-0.5
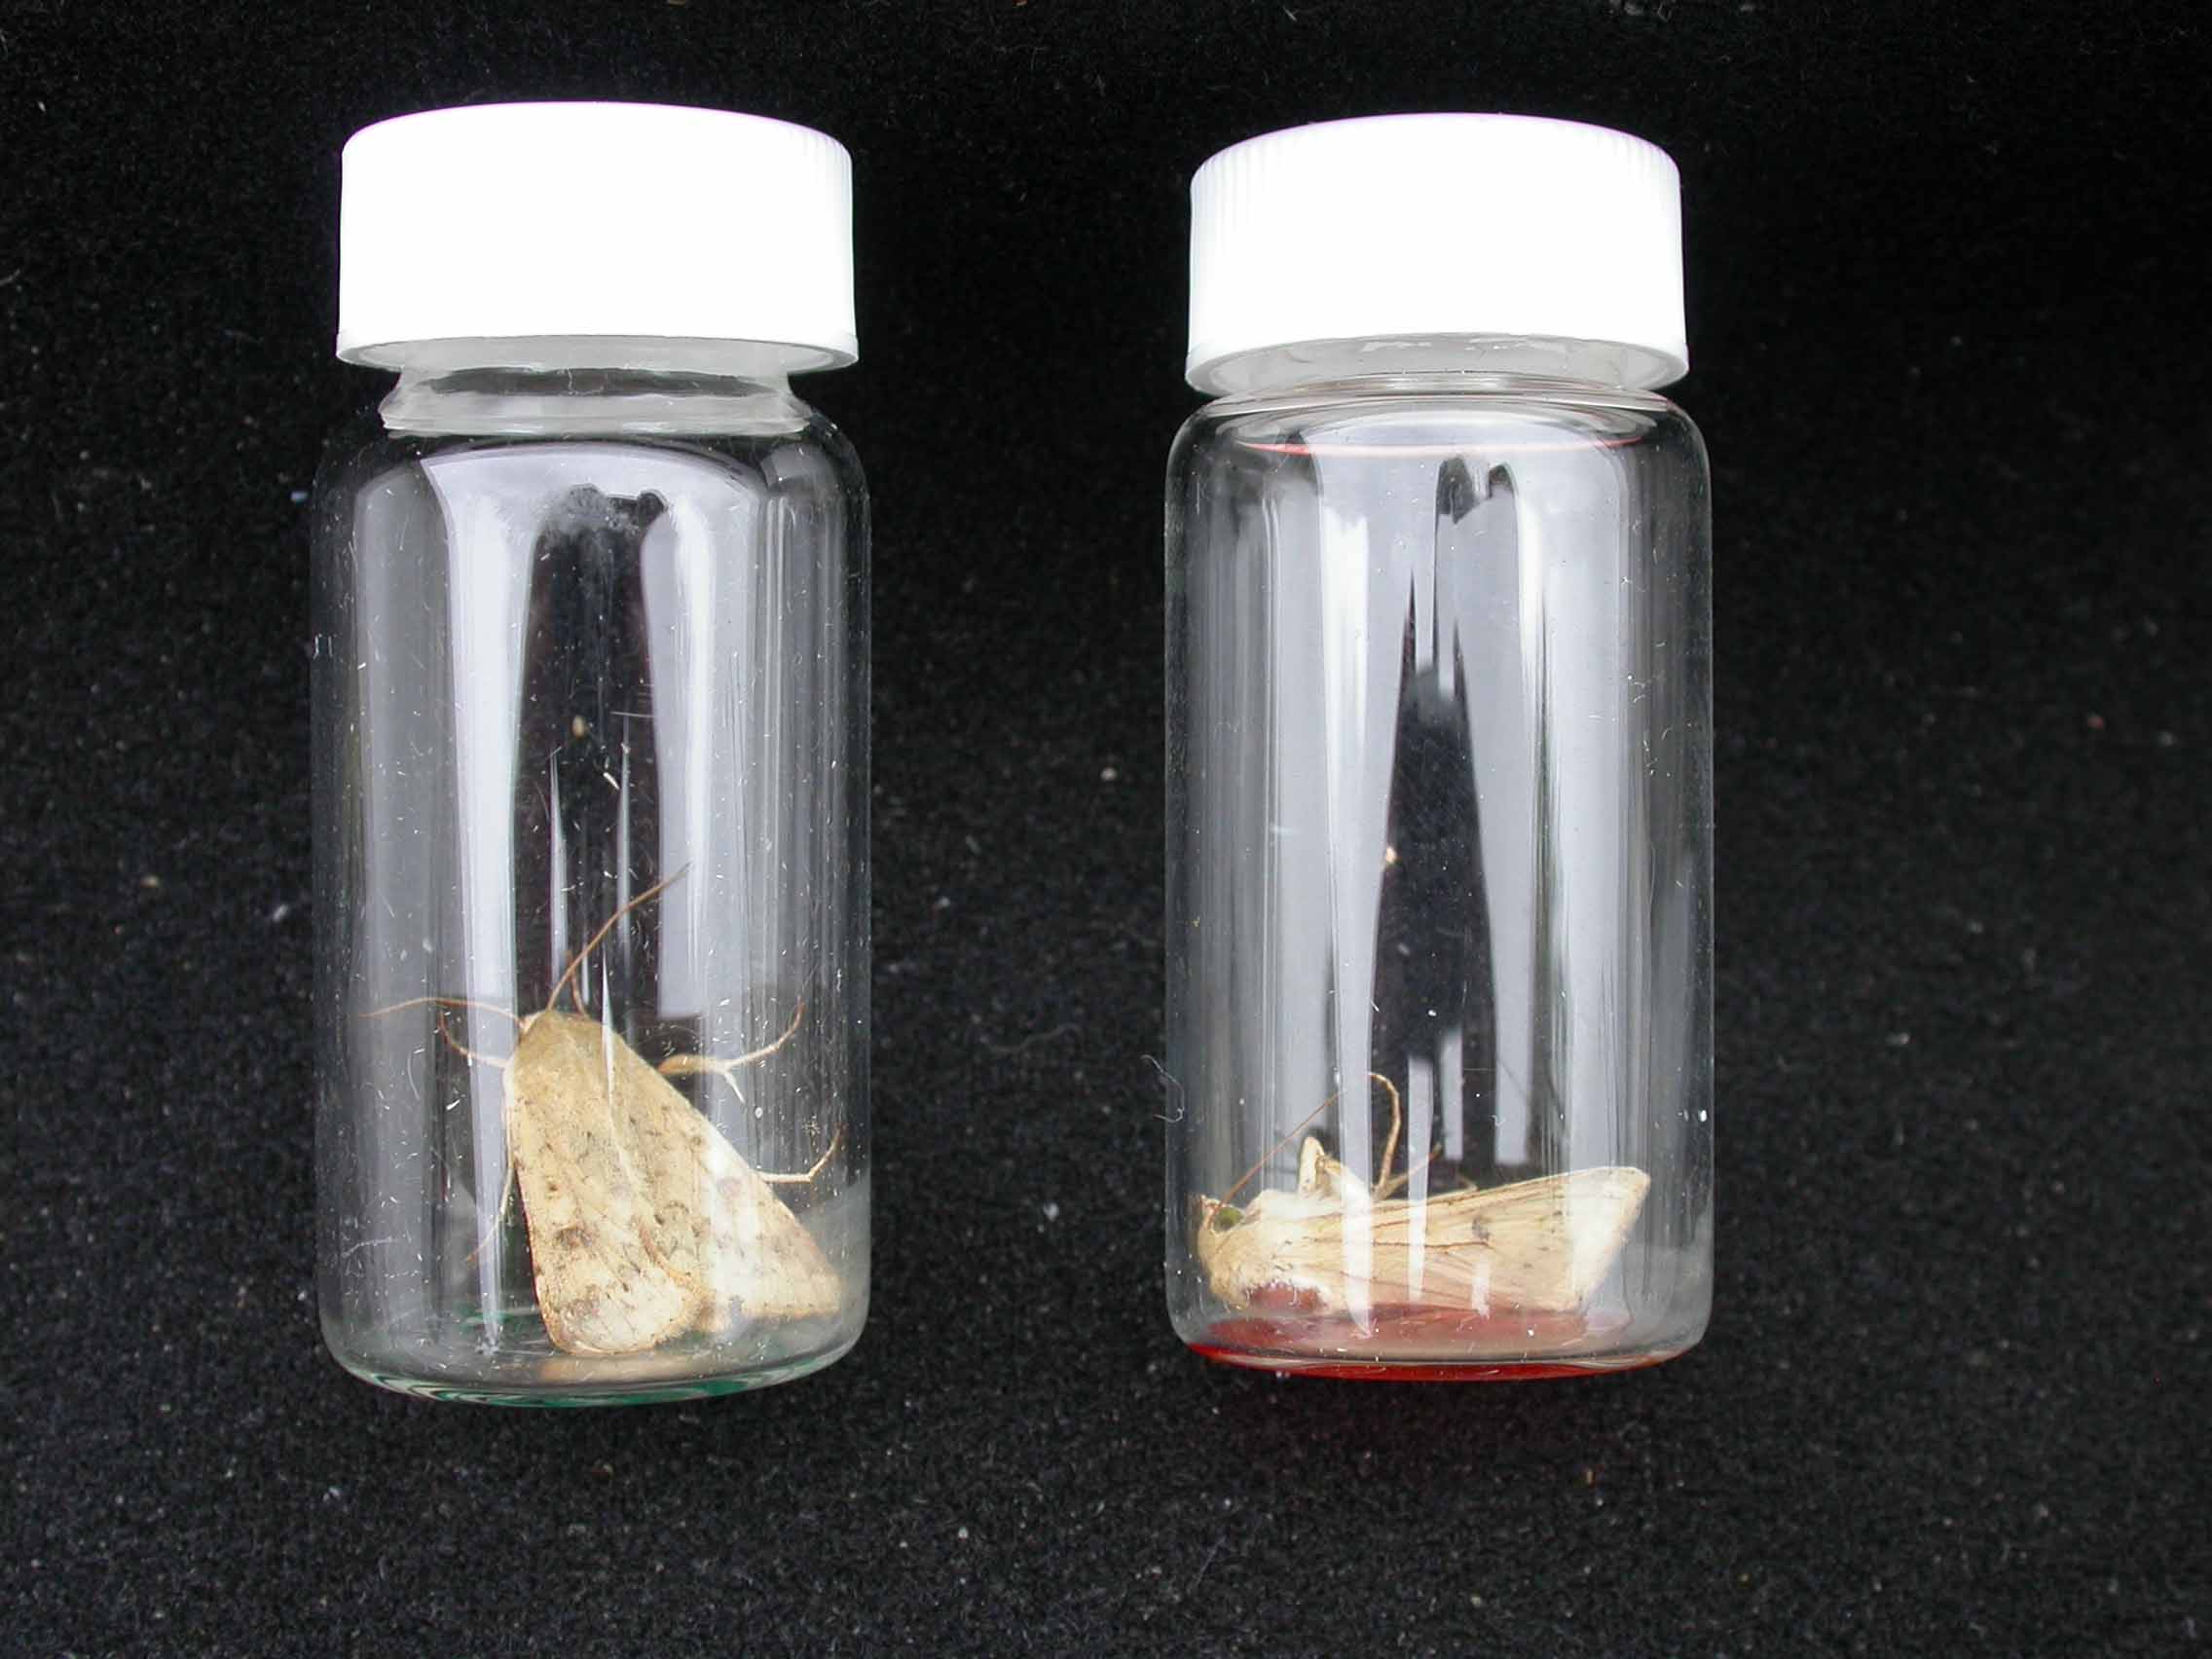
Corn earworm moth resistance monitoring update for July 2, 2015
To date, Dr. Herbert’s crew have tested 157 corn earworm moths in the 2015 pyrethroid vial test experiment, with an average of 21.3 percent of moths surviving the 24-hour exposure to the 5 microgram rate of cypermethrin. Please see the attached line graph for more details. July2VialTest
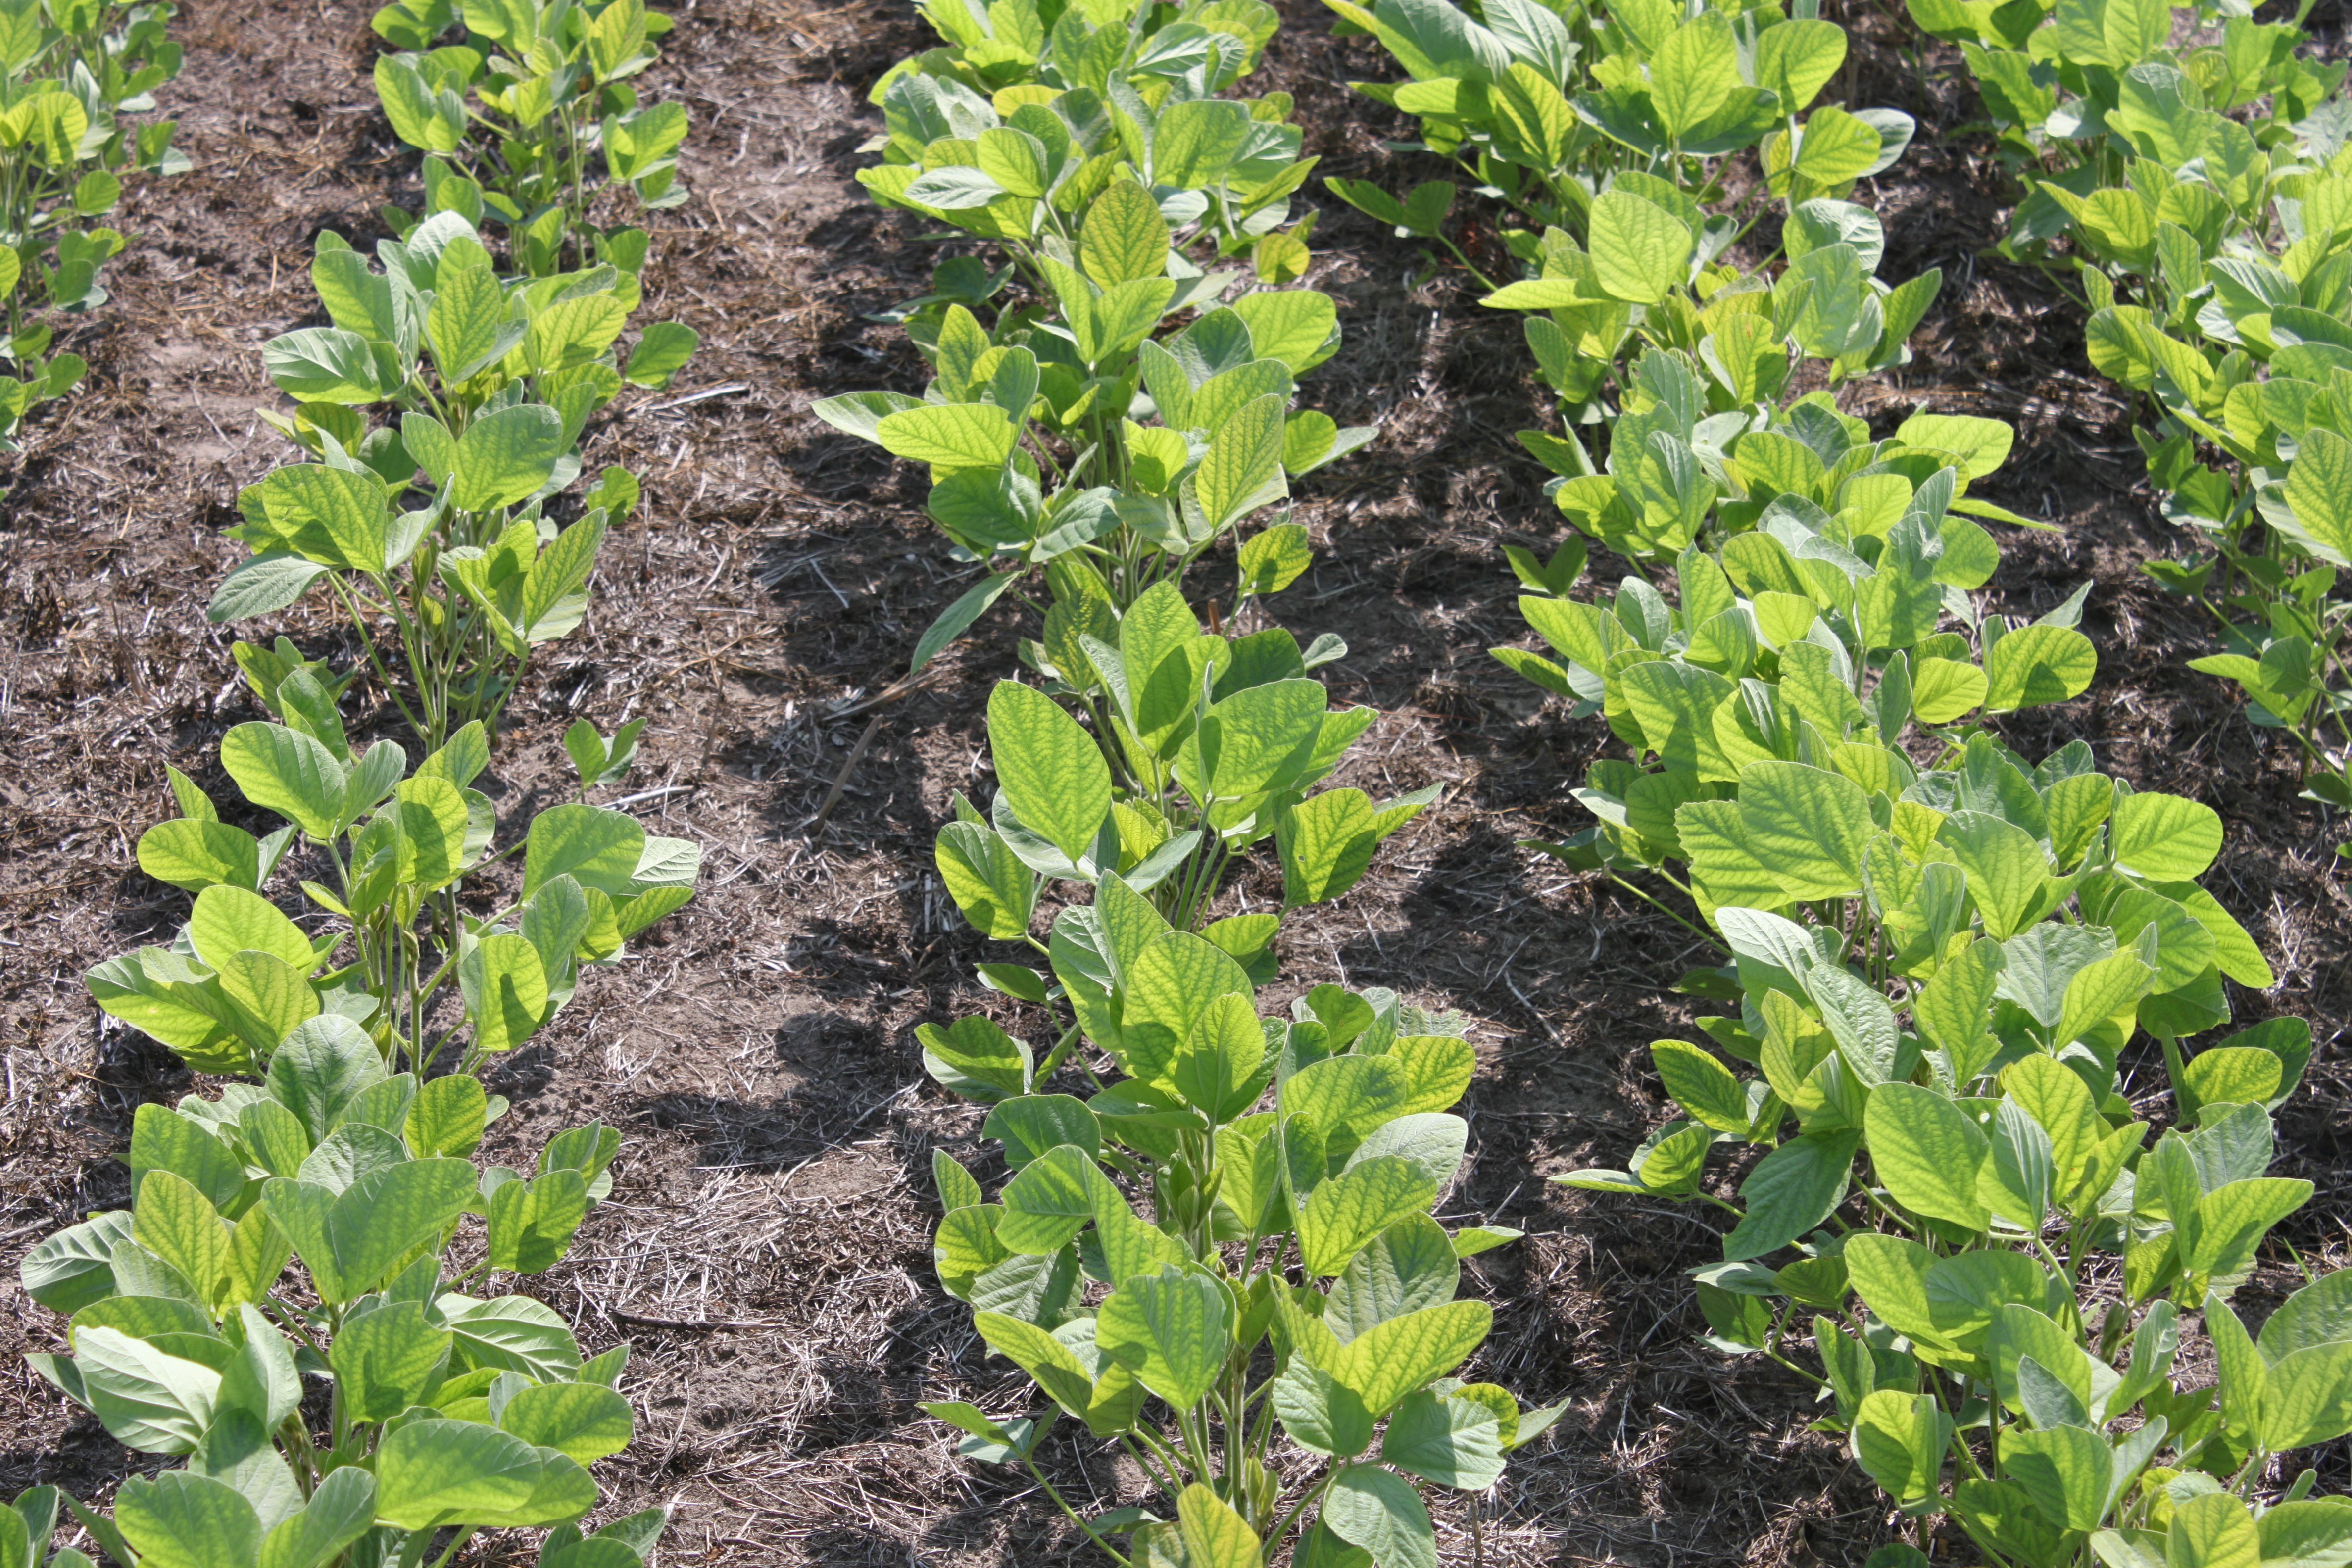
Manganese Deficiencies in Soybean
Manganese (Mn) deficiencies are starting to appear. Such a deficiency is common in Virginia soybean, but these deficiencies are not necessarily due to low Mn levels in the soil. Instead, like many micronutrients (nutrients that are needed by the plant in small amounts), Mn availability to the soybean crop is directly related to soil pH.
When pH levels reach 6.5 or above, Mn deficiencies will likely appear, especially on sandy soils. However, some soils with a pH of 6.2 and lower can show deficiencies if soil Mn is low. Generally, Mn deficiencies are more common on our sandier soils as pH changes more rapidly and sandy soils typically have a lower Mn concentration.
The deficiency will appear interveinal clorosis, usually on the younger leaves first since Mn is not a mobile nutrient. 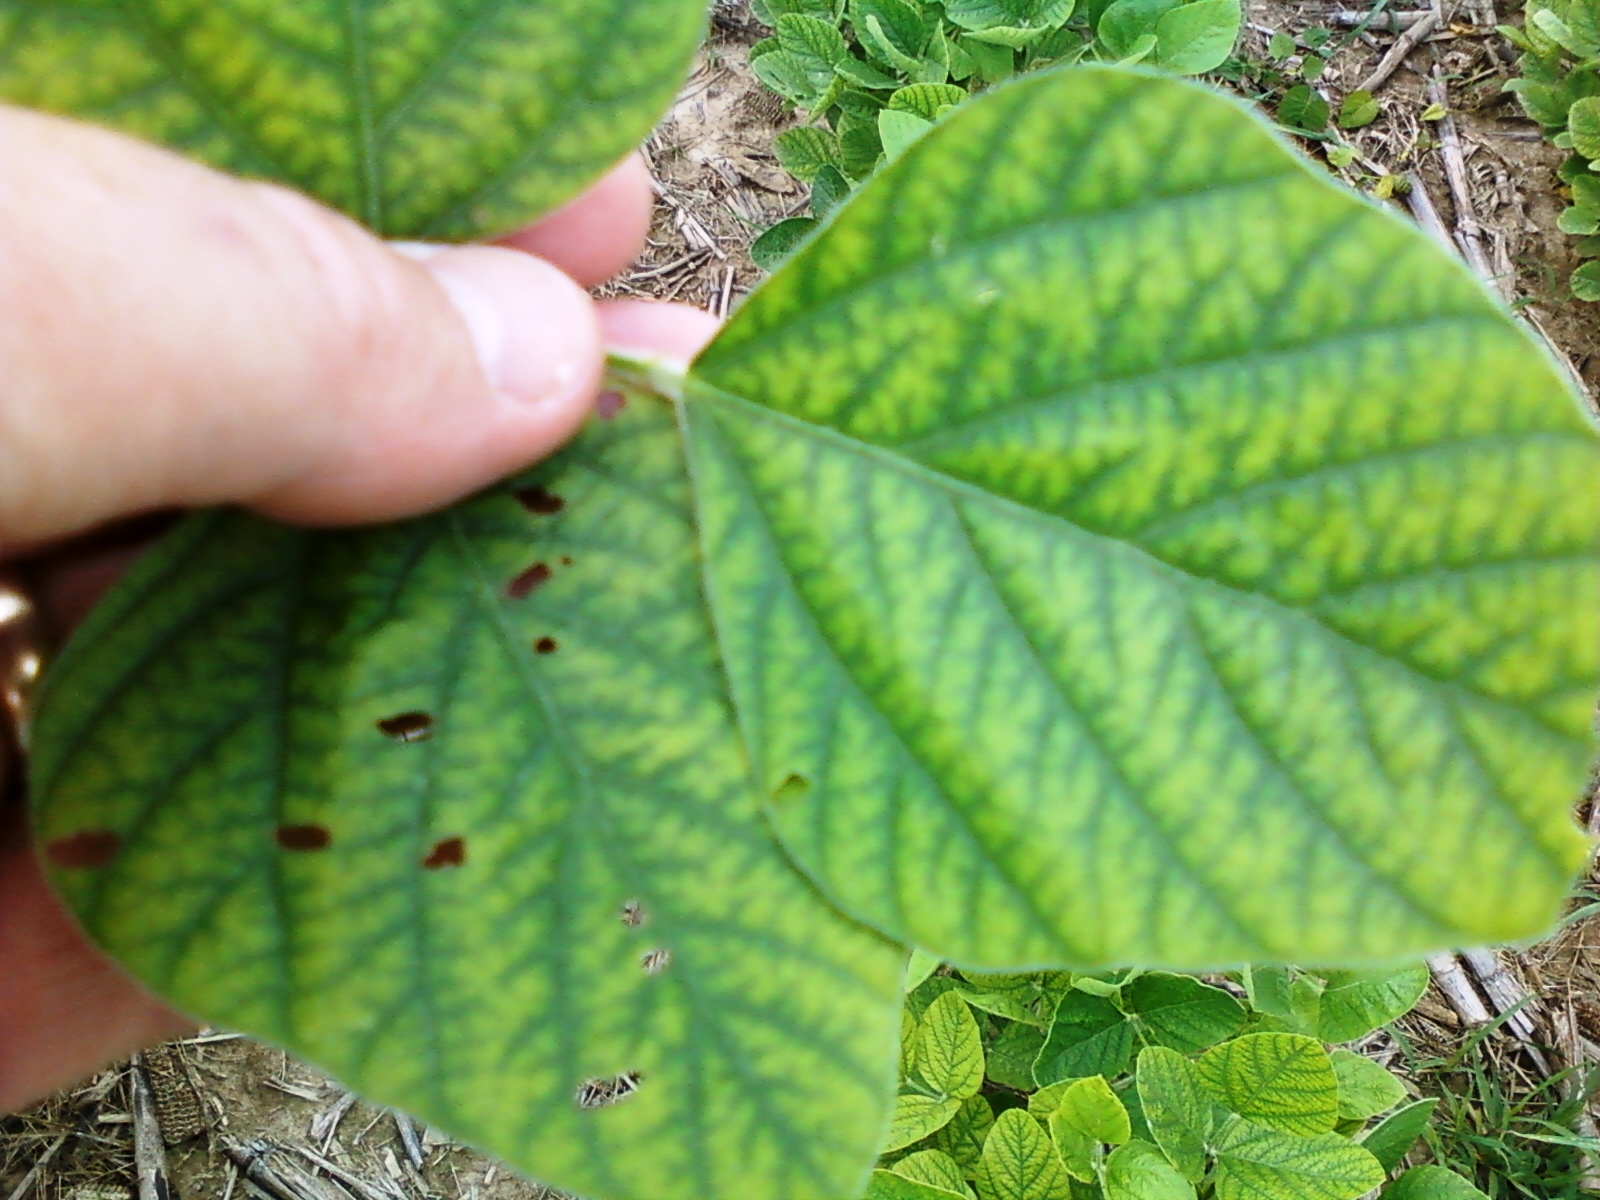 This may distinguish Mn deficiency from magnesium (Mg) deficiency. Magnesium deficiency symptoms will usually appear on the lower leaves while the upper leaves remain green. Still, I’ve seen Mn deficiency on the lower to middle leaves. This usually happens when the field has not been checked in a while and the observer missed the symptoms when they were on the younger leaves.
Other problems can cause look-alike symptoms similar to Mn deficiencies. In particular, inter-veinal yellowing is a common symptom of soybean cyst or other nematode damage. Therefore, it may be prudent to further investigate the problem, especially the root system.
Use the following guidelines for Mn applications:
Scout your fields. Mn deficiencies may or may not materialize. The only sure way to determine a deficiency is to observe the deficiency symptoms through visual observation or tissue tests. The characteristic visual symptom is yellowing between the veins on the new leaves. Mn is an immobile nutrient. Therefore, it will not move out of older leaves to the new leaves. Symptoms will appear when the plant can no longer extract sufficient amounts of the nutrient from the soil.
Take a tissue sample. If Mn deficiencies are suspected due to high pH and/or a field history of Mn deficiencies, but no symptoms have yet appeared, you should consider taking a tissue sample. Tissue samples can reveal deficiencies before symptoms appear (hidden hunger). We suggest a tissue test if lime, lime stabilized biosolids, or an ash product was recently applied.
Manganese application. To overcome a deficiency, apply ¾ lb. chelated Mn (elemental basis) or 1 lb. inorganic Mn (elemental basis) per acre to foliage upon appearance of symptoms and prior to flowering. More than one application may be required to correct a severe deficiency.
Don’t use low rates to correct a deficiency. Note that many Mn products recommend applying lower rates of Mn. However, the label usually states that these are maintenance rates. Once a deficiency occurs, these lower rates will not correct the deficiency and the rates stated above will be needed.
Split Mn application on deficiency-prone soils. An alternate method of application can be used before a deficiency is evident on soils that commonly show a deficiency, especially on soils that have a high pH (above 6.8 or so). A lower rate (~ ½ of that listed above) can be combined with another scheduled application, such as a postemergence herbicide or insecticide. This may be a sufficient rate to prevent a deficiency from occurring. But, continue to scout the field and take future corrective measures if visual deficiencies appear. If a visual symptom appears, you need to use the full rate. I will remind you that this is a preventative treatment. A deficiency may not occur. Furthermore, these are only maintenance rates and another application will likely be needed if the field is truly deficient.
Use EDTA chelated Mn formulations when mixing with glyphosate. Be reminded that some Mn formulations in combination with glyphosate herbicide (Roundup, Touchdown, many generics, etc.) will result in reduced weed control of certain weeds. Other herbicides have not shown to interact. If including Mn with glyphosate, use the EDTA chelated formulation as it has shown not to interact.
Don’t spray if you don’t need it. Mn can be toxic to soybean. Spraying greater than recommended rates or spraying as a preventative spray when soil pH is relatively low (5.7-5.9) could lead to toxicity problems
Black flag seen in some Virginia cotton fields
As you may have heard, reports out of northeastern North Carolina are talking about infestations of plant bugs (Lygus) causing a symptom called “black flag” by feeding on presquare cotton. This is very rare in US cotton. This symptom is termed “black flag” due to the death and blackened appearance of the expanding terminal leaves. The danger is creating “crazy cotton”, which is loss of apical dominance, causing multiple terminals per plant, delayed squaring, or yield loss. Terminals can be destroyed from only 20 minutes of feeding.
But it is important to remember that given good conditions, cotton can recover later in the season without yield loss. We did research earlier in Virginia that showed that even this far north, cotton can easily compensate from removal of squares—even up to 20 percent—so this black flag injury may not be as big a threat as you may be thinking it is.
The plant bugs that are causing this problem are from a generation that developed on weeds and is moving through the system. It is important to keep in mind that plant bug infestations are very erratic. Some fields may be infested, or even some areas within a field—but not every field. We and others have checked a lot of cotton fields in Virginia and are finding just a few with very limited amounts of black flag.
We don’t want to overreact to this and spray all of our cotton just because we have seen this problem in a few plants in one area. If you do see these symptoms you should use a sweep net to see if plant bugs are still present (see recommendations below). Overreacting could certainly help flair other problems as well as waste money if plant bugs are not present at damaging levels.
Management on presquare cotton (borrowed from NCSU)
1. Use a sweep net to make 25 sweep samples and count the adults. Realize that bug numbers will be higher in field edges, so move around. A sample of 25 sweeps per location (one set of 25 “swooshes”) should be adequate.
2. Where you sweep, look for black flag, wilted leaves, or injured terminals. If you see this injury, and have plant bugs present, spray if the number of injured terminals is greater than 1 plant in 10 feet of row (borrowed from Mississippi State). If you do decide to spray, use a neonicotinoid at the highest labeled rate at this point in the season. They tend to be less effective as the season goes on, but should do the trick, while preserving some beneficials. Examples include Admire Pro, Belay and Centric. DO NOT use an organophosphate or pyrethroid this early in the season. These will kill the beneficials and could help flare spider mites and/or aphids. We are seeing some of both in a few fields so the risk of flaring these pests is pretty high—and would be very costly.
3. Monitor the situation after the spray. A visit and sweeping 24 hours following the spray should give you a good idea of knockdown. Since you’ve swept and know the plant bug numbers prespray, another good visit would be 4-5 days later. See if plant bugs have migrated in again and if the terminal injury is holding steady or increasing.
4. Once the plants start squaring, you need to use a threshold that incorporates plant bug numbers with square retention measurements. You can find scouting recommendations and the threshold for squaring cotton in the Virginia Cotton Production Guide, http://www.pubs.ext.vt.edu/AREC/AREC-124/AREC-124.html.
Virginia/Northeastern North Carolina Cotton Field Day
Attached you will find the flyer (including pre-registration instructions and topics) for the upcoming Virginia/Northeastern North Carolina Cotton Field Day. It will be held on August 11, 2015 at 8 am at the Virginia Tech Tidewater AREC MAIN FACILITY (on Route 58, not the Hare Road farm). Here is the flyer→2015 VA-NC Cotton Field Day