Category Archives: Soybean

Update on soybean insect pests in Virginia

In mid July we initiated our annual soybean insect pest survey, our black light trapping program, and our corn earworm pyrethroid resistance monitoring program. Following are short updates.

BMSB (brown marmorated stink bug): So far this summer, only a TOTAL of 4 BMSBs have been found in soybeans—one in a field in Amelia Co. and 3 in a field in Bedford Co. (see the attached BMSB occurrence map). This breaks all records for the fewest for this time of year. Was it the cold winter, or those unusually hot days in June (BMSB does not do well when temperatures exceed the mid 90s)? We will continue posting our field survey results but all indicators point to a season with very low risk to BMSB infestations in the Virginia soybean crop.  BMSB_map_30_July_2015

Kudzu bug: As of the end of July, kudzu bugs have been found in soybean fields in 21 southern/eastern counties (see the attached kudzu bug occurrence map)—but in all cases, these have been adults only, and at very low numbers. Most counts reported by our scouts were 1 or fewer adults in 15 sweeps, and occasionally 2 per 15 sweeps. These numbers are way too low to be a threat to fields and DO NOT warrant treatment. These adults represent the first generation that will set up the nymphs that could cause concern later, but only if numbers increase a lot. Our best guess based on what we are seeing in fields now, and the lower number that successfully overwintered compared with last year, is that not many, if any, fields that will reach the nymphal threshold.  KB_map_30_July_2015

Corn earworm moth activity: We are seeing an increase in CEW moth activity just in the last week and what we think is the beginning of the flight from field corn. Our local pheromone traps have gone from just a few caught in a week, to averaging in the teens and twenties. We are just beginning to see moths fly up in crop fields as we walk the rows, and some local growers are seeing the same. On a separate advisory we have posted the results of the annual corn earworm field corn survey—which showed a statewide average of only 17.5% ears infested. This is even lower than the numbers reported in 2014 (20%) and 2013 (18%)—both years with very few cotton, peanut or soybean fields being infested with treatable numbers of worms. So far, all indicators point to another year with few fields reaching thresholds. We will continue monitoring and posting updates.

Corn earworm pyrethroid resistance: To date we have tested 255 moths (see the attached line graph). We started the season with about 15% survivorship at the end of June and as of the end of July are up to 40% survivorship. This level, this early in the season is cause for some concern. We will be posting updates often.  Vial_tests_30_July_2015

Should I Apply a Foliar Feed to My Soybeans?

The high prices over the last few years have allowed many of us to experiment with certain practices that, at best, might occasionally increase yields.  The return of investment usually only required one bushel (or less), depending on the input.  But that was when soybeans were $13, $15, and even $17 per bushel.  But now, you may be able to sell your crop for $10-11 (if you still have any in storage) and the future prices are reflecting record acreages.

So, it seems that I’ve been asked, “Should I apply a foliar feed to my soybeans?” more this year than in the past few years.

First, I still stand by what I’ve said in the past and still say today: “Feed the roots and not the foliage.”  Soybean will remove 3 to 4 lbs of nitrogen, 0.8 lbs of phosphorus, and 1.4 lbs of potassium per bushel of seed produced.  These large amounts will need to come via root uptake; it is not economically possible to apply these amounts through the foliage.

But, once the soil needs are met, will additional fertilization help?

First, an application of Manganese may be needed if your soil pH inches much above 6.5.  2010-07-20-Mn-Deficiency-002webI’ve even seen Mn deficiencies when the pH is as low as 6.2 (using fall/winter soil test levels) and the soil is “wet natured” or if lime was recently applied.  There are also certain varieties that tend to show Mn deficiency sooner than others.  So, if you see the characteristic interveinal chlorosis of Mn deficiency or if soybean are growing in a field that typically exhibits such a deficiency, then spray Mn.

Another issue that I’m seeing this year is a general yellowing of plants, usually just in seemingly random spots in the field.  Upon closer inspection, these are usually very wet areas (there are plenty of those this year) or sandy knolls.  In the saturated soils, the yellowing is likely due to lack of oxygen and/or poor nodule development.  The only cure for lack of oxygen is for the soil to dry out.  Poor nodulation is indirectly a response to lack of oxygen – the nitrogen-fixing bacteria have temporarily stopped functioning.  But they will recover and provide the nitrogen when the plant needs it the most, when the pods are forming and seed are filling.  Will a shot of foliar nitrogen help?  Yes, it will green up the plant if lack of nitrogen is the problem.  Will this shot of nitrogen (assuming that nitrogen is the problem) increase yield?  Maybe.  Maybe not.  If lack of oxygen is the problem, then probably not.  Even if lack of nitrogen is the problem, probably not.

I want to caution everyone to not make assumptions that lack of nitrogen is the problem.

Is this N or S deficiency?

Is this N or S deficiency?

The only way to know for sure is to take a tissue sample. A deficiency that closely resembles nitrogen deficiency is sulfur.  On those sandy knolls, I’ve seen sulfur deficiencies.  Sulfur will leach just like nitrogen.  But, soybean will not produce its own sulfur.  A shot of nitrogen would do nothing to help in this case.  The take home message is to determine the cause, then act on that information.

But what about other nutrients?  What if there is no visual symptoms of nutrient stress?  What if my yield potential is very good?  My attitude towards this is that it usually won’t hurt (but be careful mixing with other chemicals), so do what makes you sleep better at night.  If you think it is helping your crop, then make the application.  It’s your money.  You know your fields better than anyone.  But, I have rarely seen a response to foliar feeds if you have maintained adequate soil fertility levels and have managed the crop for maximum economic yields.  Again, yield response to foliar fertilizers is, at best, inconsistent.

Kudzu bug distribution update for July 16, 2015

Our scouts (Ed Seymore, Jamie Hogue, and Dr. Herbert’s Entomology team) have started sampling soybean fields across Virginia for kudzu bug and brown marmorated stink bug.  The file attached at the end of this paragraph indicates the counties where kudzu bug has been found (blue counties = kudzu bug found in soybean; maroon counties = kudzu bug found on other hosts such as kudzu).  Please note that we have not yet sampled all counties on our survey route.  I will continue to provide weekly updates on this, including pest population levels, as the season progresses.   KB_7_16_2015

Fungicide Resistant Frogeye Leaf Spot Present in Virginia

Fungicides are an important and effective tool for management of fungal diseases of crops including soybean. Unfortunately, over time fungal pathogens have the potential to develop resistance to specific fungicide modes-of-action. Mutations conferring resistance to fungicides are relatively rare, but multiple applications of the same fungicide chemistry impose selection pressure on pathogen populations and increase the frequency of those mutations over relatively short periods of time. Thus, specific fungicide chemistries have the potential to lose their effectiveness over time. Fungicide resistant isolates of Cercospora sojina, the causal agent of frogeye leaf spot in soybean, have recently been confirmed throughout the southeast including in North Carolina in 2013 and Virginia in 2014. In 2014, a small preliminary survey was conducted to determine if fungicide resistance is occurring in Virginia populations of frogeye leaf spot. Four fields were tested, and two of those fields had fungicide resistant strains. The resistance is specific to strobilurin (QoI, FRAC group 11) fungicides, which are highly effective for control of fungal foliar diseases but to which resistance can rapidly occur within fungal populations. Effective foliar disease management requires appropriate fungicide chemistry selection based on the specific pathogens present and their sensitivity to different fungicide modes of action.

Additional isolates of the frogeye leaf spot pathogen from throughout Virginia need to be collected and tested for fungicide resistance so that appropriate fungicide recommendations can be made. Other states have already initiated fungicide resistance monitoring programs for the causal agent of frogeye leaf spot (C. sojina), and we will implement a similar program in Virginia. Soybean leaves with symptoms of frogeye leaf spot will be collected throughout the 2015 growing season, the fungus will be isolated, and isolates will be tested for resistance to strobilurin (QoI) fungicides. If fungicide resistance is widespread in Virginia, recommendations for foliar fungicides and/or cultivar selection may need to be modified. If incidence of fungicide resistance is low, we will continue to monitor fungal populations and assess the risk of fungicide control failures on a year-by-year basis.

Frogeye leaf spot

In order to implement an effective fungicide resistance monitoring program, we are requesting that leaf samples from soybean fields with symptoms of frogeye leaf spot (see pictures above) be submitted to the Tidewater AREC for testing. For more information on submitting samples, please contact Dr. Hillary Mehl (757) 657-6450 ext. 423 or hlmehl@vt.edu.

Manganese Deficiencies in Soybean

Manganese (Mn) deficiencies are starting to appear.  Such a deficiency is common in Virginia soybean, but these deficiencies are not necessarily due to low Mn levels in the soil.  Instead, like many micronutrients (nutrients that are needed by the plant in small amounts), Mn availability to the soybean crop is directly related to soil pH.

When pH levels reach 6.5 or above, Mn deficiencies will likely appear, especially on sandy soils.  However, some soils with a pH of 6.2 and lower can show deficiencies if soil Mn is low.  Generally, Mn deficiencies are more common on our sandier soils as pH changes more rapidly and sandy soils typically have a lower Mn concentration.

The deficiency will appear interveinal clorosis, usually on the younger leaves first since Mn is not a mobile nutrient.  MnDeficiency0721101059This may distinguish Mn deficiency from magnesium (Mg) deficiency.  Magnesium deficiency symptoms will usually appear on the lower leaves while the upper leaves remain green.  Still, I’ve seen Mn deficiency on the lower to middle leaves.  This usually happens when the field has not been checked in a while and the observer missed the symptoms when they were on the younger leaves.Cyst nematode on roots

Other problems can cause look-alike symptoms similar to Mn deficiencies.  In particular, inter-veinal yellowing is a common symptom of soybean cyst or other nematode damage.  Therefore, it may be prudent to further investigate the problem, especially the root system.


Use the following guidelines for Mn applications:

Scout your fields.  Mn deficiencies may or may not materialize.  The only sure way to determine a deficiency is to observe the deficiency symptoms through visual observation or tissue tests.  The characteristic visual symptom is yellowing between the veins on the new leaves.  Mn is an immobile nutrient.  Therefore, it will not move out of older leaves to the new leaves.  Symptoms will appear when the plant can no longer extract sufficient amounts of the nutrient from the soil.

Take a tissue sample.  If Mn deficiencies are suspected due to high pH and/or a field history of Mn deficiencies, but no symptoms have yet appeared, you should consider taking a tissue sample.  Tissue samples can reveal deficiencies before symptoms appear (hidden hunger).  We suggest a tissue test if lime, lime stabilized biosolids, or an ash product was recently applied.

Manganese application.  To overcome a deficiency, apply ¾ lb. chelated Mn (elemental basis) or 1 lb. inorganic Mn (elemental basis) per acre to foliage upon appearance of symptoms and prior to flowering.  More than one application may be required to correct a severe deficiency.

Don’t use low rates to correct a deficiency.  Note that many Mn products recommend applying lower rates of Mn.  However, the label usually states that these are maintenance rates.  Once a deficiency occurs, these lower rates will not correct the deficiency and the rates stated above will be needed.

Split Mn application on deficiency-prone soils.  An alternate method of application can be used before a deficiency is evident on soils that commonly show a deficiency, especially on soils that have a high pH (above 6.8 or so).  A lower rate (~ ½ of that listed above) can be combined with another scheduled application, such as a postemergence herbicide or insecticide.  This may be a sufficient rate to prevent a deficiency from occurring.  But, continue to scout the field and take future corrective measures if visual deficiencies appear.  If a visual symptom appears, you need to use the full rate.  I will remind you that this is a preventative treatment.  A deficiency may not occur.  Furthermore, these are only maintenance rates and another application will likely be needed if the field is truly deficient.

Use EDTA chelated Mn formulations when mixing with glyphosate.  Be reminded that some Mn formulations in combination with glyphosate herbicide (Roundup, Touchdown, many generics, etc.) will result in reduced weed control of certain weeds.  Other herbicides have not shown to interact.  If including Mn with glyphosate, use the EDTA chelated formulation as it has shown not to interact.

Don’t spray if you don’t need it.  Mn can be toxic to soybean.  Spraying greater than recommended rates or spraying as a preventative spray when soil pH is relatively low (5.7-5.9) could lead to toxicity problems

Soybean Replant Decisions

Deciding whether or not to replant can be a gut-retching decision.  I readily admit that the choice to leave the present stand or replant is not a simple one.  With the cost of seed and diesel fuel, the profitability of replanting may not seem a good idea.  Low prices make this no more appealing.  In the end, your decision should be one based on the estimated dollar gain from replanting.  This will require a careful evaluation of the soybean stand and an analysis of yield potential of the present and replanted crop.

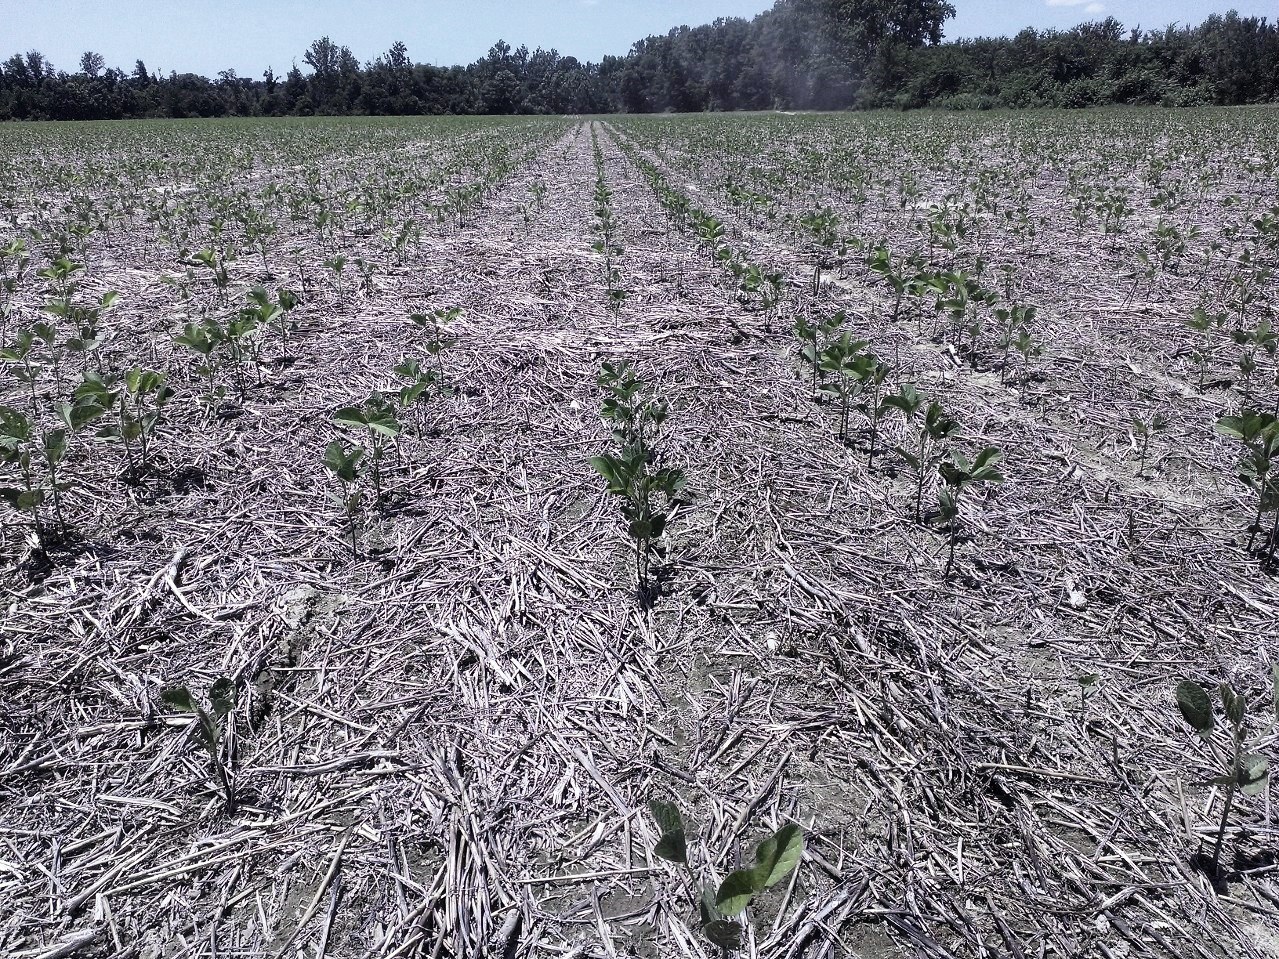
In general, there is less benefit of replanting if stands are reduced uniformly across the field.  Usually replanting can only be justified where stands have been reduced by half.  However, poor stands usually include gaps in addition to merely a lower plant population.  These gaps must be accounted for.  In addition, one may have a 75-80% stand in parts of the field, while other parts of the field may only have 20-25% of the intended plant population; the decision may be to only replant part of the field.

Remember to take into account the yield loss from delayed planting.  Up until mid-June, there is very little yield loss from delayed planting.  After this, for every day delay in planting yield declines about half a bushel per day.  For instance, if replanting in late-June/early-July (about 2 weeks late), your potential yield will have declined by 7 bushels per acre.

A few more questions must be asked before we can proceed with a step-by-step procedure for estimating the profit of replanting.  When considering a replant, do you leave plants in the field and plant through them?  In many cases, planting through the poor stand is a possibility.  If you’re using rows wide enough to fit a tractor tire comfortably between them, then you can split the rows and plant enough new plants to get the final plant population up to 100 to 120 thousand plants for full-season systems (if re-planting before mid-June) or 180 to 200 thousand plants per acre for double-cropped systems (this may require equipment or tractor tire modifications).

On the other hand, a drill will cut up many healthy plants and make them less productive than the ones that you just replanted.  Also, if the drill has wide gauge wheels, then you can severely damage a significant number of plants (there’s a significant amount of down pressure on those wheels – enough to crush a plant on hard soil).  And a damaged plant can sometimes act more like a weed than a crop.  Recognize that the plants growing in the field are going to be higher yielding that any that emerges after replanting.  If you destroy or injure those plants, you’ve just writing off some profit.  Therefore, I do not suggest planting through the old stand with a drill.

Another issue is that if you decide to replant, do you switch to an earlier maturity group?  There is little need to plant an earlier-maturing variety.  Here are two general rules of thumbs:

April/May Plantings:  A 3-day delay in planting will result in a 1-day delay in planting.  Therefore, if planting 30 days later, the crop will mature 10 days later.

June/July Plantings:  A 5-day delay in planting will result in a 1-day delay in maturity.  Therefore, if planting 15 days later, the crop will mature only about 3 days later.

Most important is to plant a maturity group that would grow as long as possible (therefore producing an adequate canopy for maximum yield) and still mature before the average frost date.  If you’re destroying the old crop and starting over, just make sure that the variety you chose will mature before a frost.  Alternatively, if you are planting into the old crop, you may want to choose a variety about one-third to half a maturity group earlier (depending on planting date differences) so that harvest maturity of both plantings will be more in sync.  For example, if you planted a relative maturity group 5.6 on June 10, then you could choose a relative maturity of 5.2 to 5.4 if replanting on June 25.

Finally, realize that you’ll need a higher plant population when planting late.  Final stand with a double-crop planting should be at least 180 thousand plants per acre.  If replanting in July, increase the seeding rate to insure at least 220 thousand plants per acre.

To estimate the profitability of replanting, follow the guidelines listed below.  Be sure to incorporate plant population and gaps in your calculations.  We’ve found that 2- to 3-foot gaps cause as much or more yield loss that from low plant populations.

  1. Determine the cause of the poor stand.  Was the poor stand the result of poor seed quality, cold wet soils, hot dry soils, planting too deep or shallow, soil crusting, herbicide injury, insect or slug feeding, poor soil to seed contact, or disease infection?  Determine if the cause can be corrected to avoid a similar situation.  If slug or insect feeding or disease is the cause, then you might expect poor stands again.
  2. Estimate the stand and percent stand loss due to gaps.  Pace off the sections of row 20 paces long in at least 6 areas of the field.  Determine (in number of paces) the total length of row lost to 2- to 3-foot gaps.  For drilled soybean, this can be interpreted at 2- to 3-foot diameter gaps.  Then determine the percent of row lost to gaps.  In addition, count and determine average number of plants per foot in sections of row not reduced by gaps.  The simplest method is to count the number of healthy plants (capable of recovery) in a length of row equaling 1/1000 of an acre.  For instance:
  • 36-inch rows = 14.5 feet
  • 30-inch rows = 17.5 feet
  • 20-inch rows = 26 feet
  • 15-inch rows = 35 feet
  • 7.5-inch rows = 70 feet

Then, just multiply your counts by 1,000 to get plants per acre.

Or, use the Tables 1 or 2 to determine remaining plant population.  The “hula hoop” method (Table 2) is valuable with drilled soybean or when rows cannot be distinguished.  This involves placing a circular measuring device such as a hula-hoop on the ground and counting the plants contained within.

Table 1. Plant populations of different row spacing with different plant counts per foot.
Plants/ foot Row Spacing
36 30 24 20 15 7.5
Plant Population (1,000’s/acre)
1 15 17 22 26 35 70
2 29 35 44 52 70 140
3 44 52 65 78 105 210
4 58 70 87 105 139 278
5 73 87 109 131 174
6 87 105 131 157 209
7 102 122 152 183 244
Table 2. Hula-hoop method for determining drilled soybean populations.
No. ofPlants Inside Diameter of Hula Hoop
30” 32” 34” 36” 38”
Plant Population (1,000’s/acre)a
6 53 47 41 37 33
10 89 78 69 62 55
14 124 109 97 86 77
18 160 140 124 111 100
22 196 172 152 136 122
26 231 203 179 160 144
aPlants/acre = no. plants ¸ (3.14 x r2 ¸ 43,560 ft2) where r = radius of hula hoop in feet.


  1. Estimate the yield of the poor stand.  Use Tables 3 and 4 to determine percent of yield potential for full-season and double-crop plantings, respectively.  Multiply this percentage by the expected yield. This is the yield to expect from the deficient stand.
    Table 3. Yield response (% of maximum) of full-season soybeans to deficit standsa.
    % Stand lost to gapsb Remaining Plant Pop (1,000’s/A)
    70 105 140
    0 95 97 100
    10 93 96 98
    20 91 93 96
    30 88 90 93
    40 83 86 89
    50 78 81 84
    60 73 75 78
    aSource: Pepper and Wilmot.  Managing Deficit Stands. 1991. Illinois Cooperative Extension Cir. 1317.bGaps of 12 inches or more; 30-inch rows


    Table 13.4.  Yield response (% of maximum) of double-crop soybeans to deficit standsa.
    % Standlost to gapsb Remaining Plant Pop (1,000’s/A)
    100 140 180 220
    0 80 88 95 100
    20 71 79 86 91
    40 61 69 76 81
    60 48 57 64 69
    aSource: 2001-2004 experiments, Suffolk, VA.bGaps of 3 feet; 15-inch rows; MG 4 variety
  2. Estimate the yield from replanting.  After mid-June, decrease the expected yields an additional half of a bushel per acre per day delay in planting.  This is the yield to expect from delayed planting.
  3. Determine the gain or loss from replanting.  Subtract the expected yield of the poor stand (step 3) from the yield expected from delayed planting.  This is the gain or loss in bu/A from replanting.  Multiply this number by the expected price ($/bu), using future prices, to obtain gain or loss in $/A.
  4. Estimate the cost of replanting.  Include per acre cost of tillage, herbicide, fuel, seed, and labor.
  5. Determine profitability of replanting.  Subtract your cost of replanting from your estimated gain from replanting.
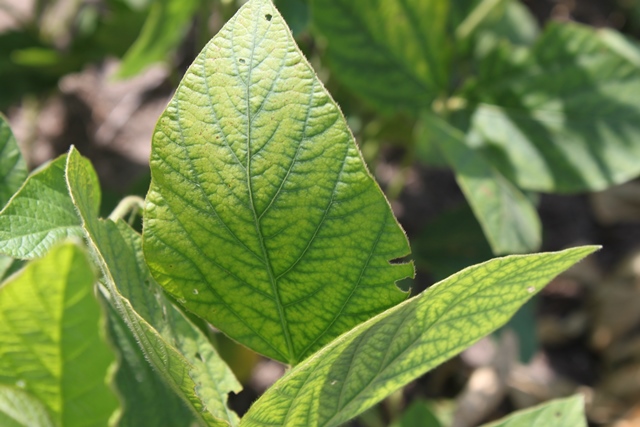
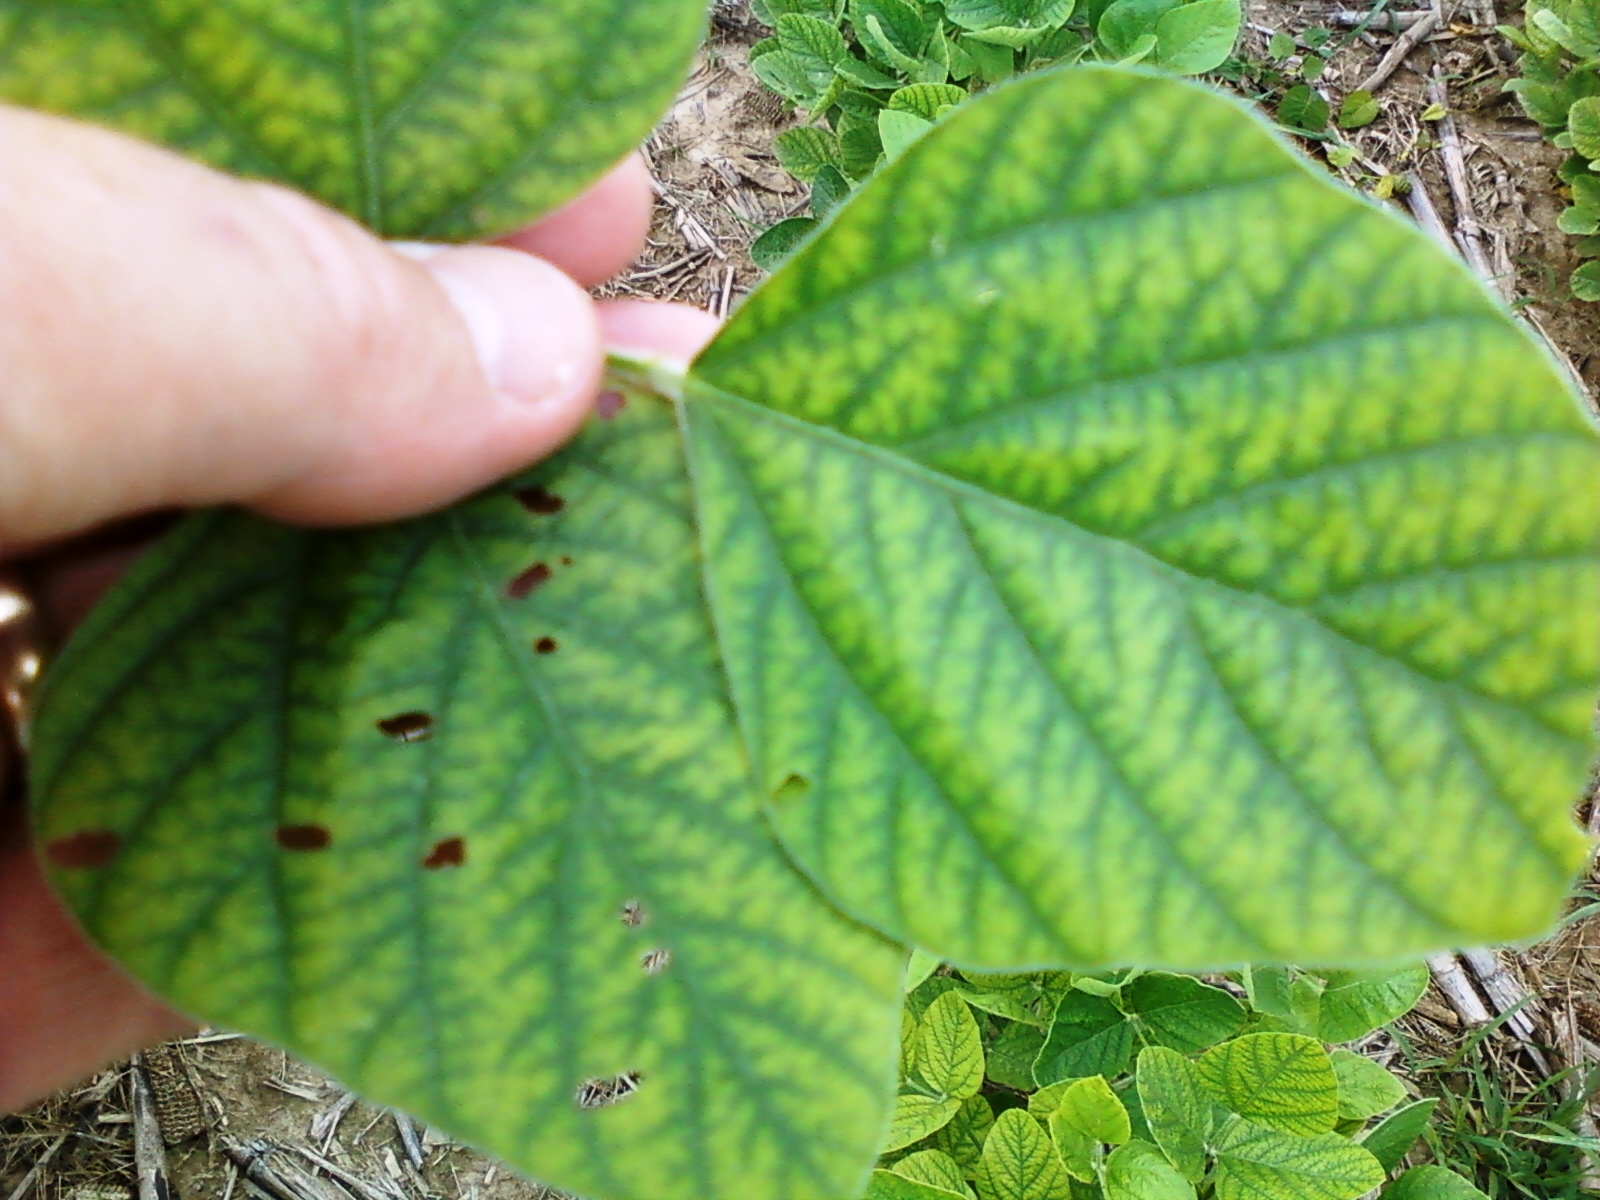
 

It’s Time to Start Increasing Soybean Seeding Rates

Mature wheat
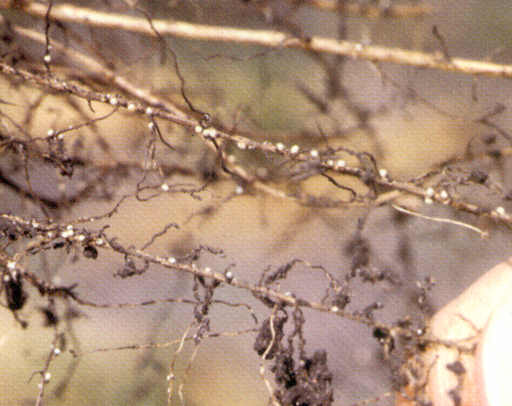
Small grains are maturing rapidly and soybean planting will soon follow.  While there is little benefit to having more than 70 to 80 thousand uniformly-spaced soybean plants per acre when planted in May, more plants will be needed to maximize yield potential as planting date is delayed later into June.  My general seeding rate recommendations (seed per foot, depending on row spacing) are listed in the table below.  Suggested Soybean Seeding Rate TableNote that I give a range for full-season, double-crop after barley, and double-crop after wheat.  The range represents how the optimal seeding rate will vary depending on yield potential (determined largely by soil type and weather), planting date, and uniform spacing.  With soybean, greater yield potential usually means that lower seeding rates can be used (opposite from corn).  This basically reflects the capacity of the soil to produce more-than-adequate leaf area to fill in relatively wide spacing and/or gaps between plants within a row.  If it’s a productive soil (good plant-available water-holding capacity and good fertility), early plant growth will generally be greater due to lack of stress.  In contrast, if the soil is not as productive, stress may prevent soybean from filling in gaps within and between rows as quickly; therefore, more plants per acre are needed.

Secondly, as planting is delayed, greater seeding rates are needed to make up for the lost time.  Although this is not a big factor until the second or third week of June, yield falls rapidly afterwards, on average about 1/2 bushel per acre per day delay in planting.  More seed per acre will make up for much of this yield loss.

Finally, note that I stated “uniformly-spaced” plants.  Many drills are just pushing seed out a small opening GP1200 Drill Seed Feed Back View Close
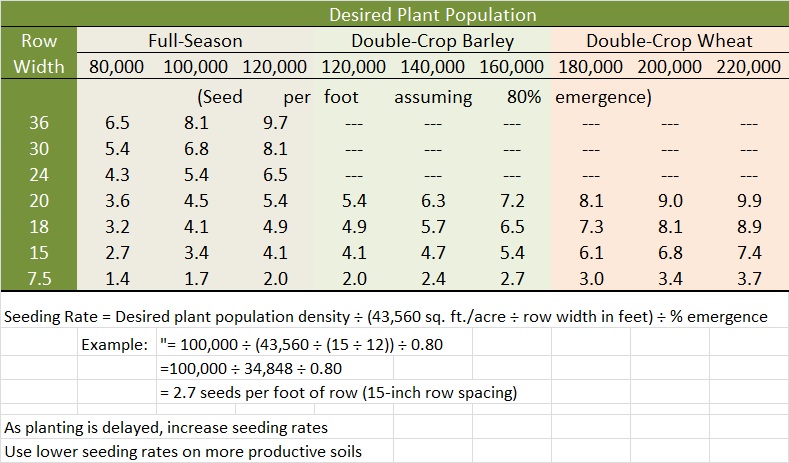
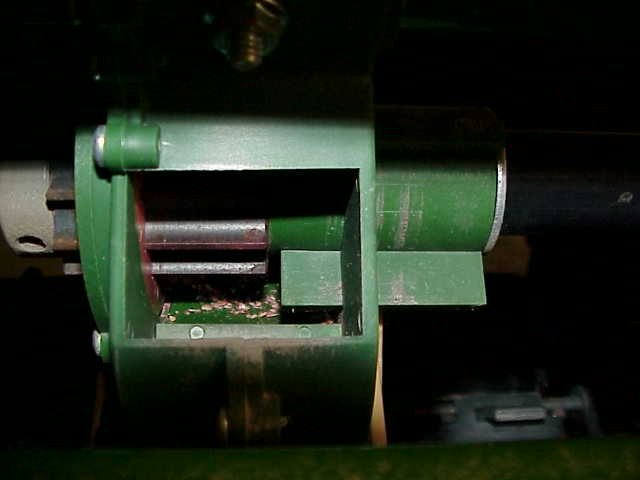
and this seed then bounces to and fro within a long tube (this is sometimes referred to as a “controlled spill”).  Without a metering system near the disk opener, this will result in a stand that is far from being uniform – it’s over-planted in some areas, it’s under-planted in others).  Therefore, I lean towards the higher seeding rates with planted with a drill that does not meter the seed.

So, where are we today?  I lean towards planting around 150 to 180 thousand seed per acre (to give 120 to 140 thousand plants per acre).  You should begin to slowly bump up that seeding rate as we near the end of June.  We have conducted numerous double-crop soybean experiments over the years.  Our data indicate that, in most cases, we need 180,000 plants per acre by the end of June in order to maximize our yield.

Although these seeding rate recommendations are based on lots of data, only the growing season will determine if we chose the correct rate.  If we have plenty of sun and rain, little to no plant stress, and excellent early-season vegetative growth, these seeding rates will be too high.  But if the opposite occurs, we’ll need all the plants that we can fit into a field.