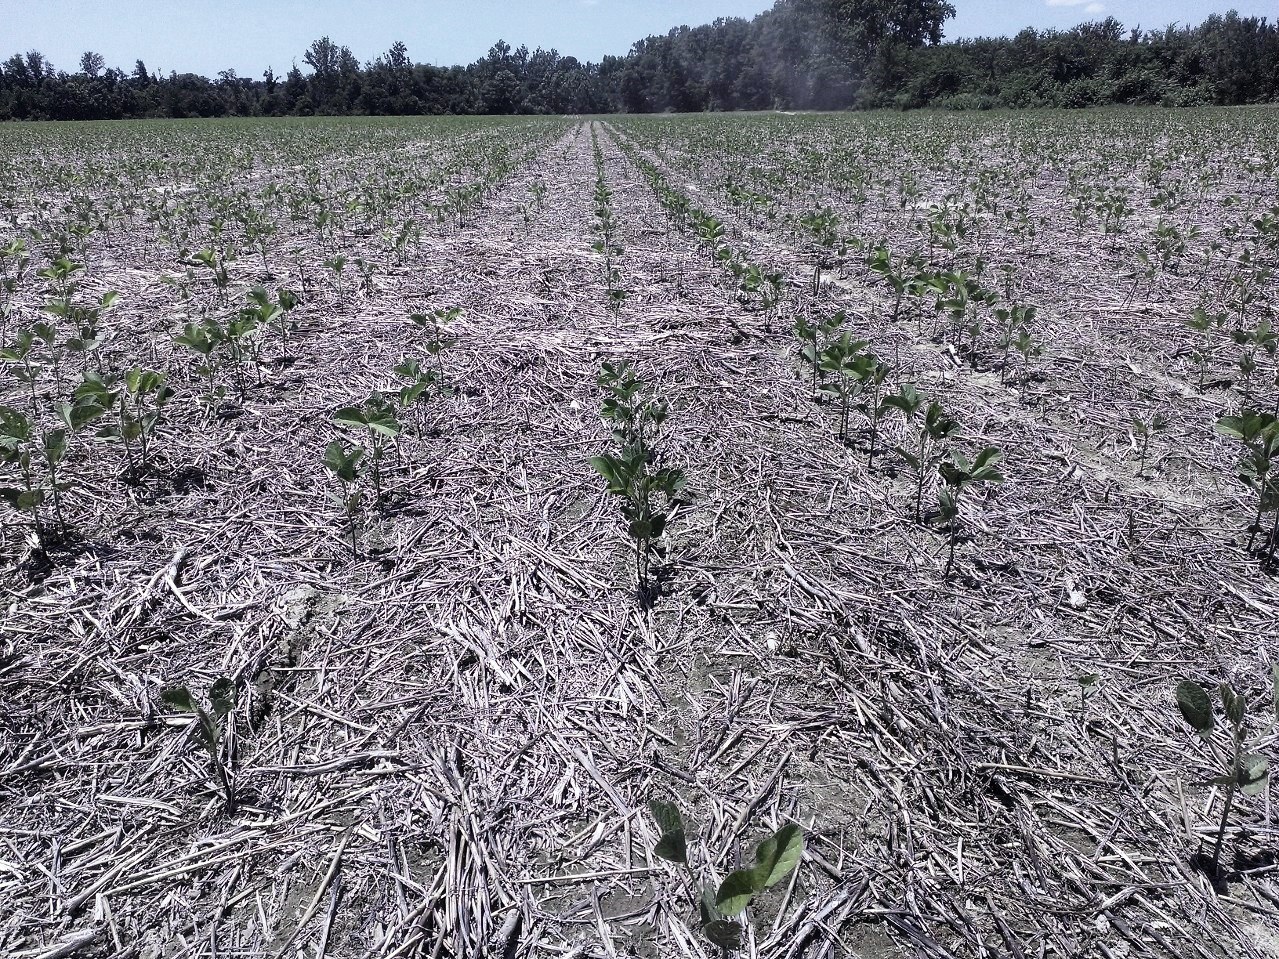
Determining whether or not to replant is hard. To ease the pain, I’ve summarized some relatively simple steps to help in your decision. One should incorporate 2- to 3-foot gaps into your decision to improve the estimation of yield loss.
- Determine the cause of the poor stand. Was the poor stand the result of poor seed quality, cold wet soils, hot dry soils, planting too deep or shallow, soil crusting, herbicide injury, insect or slug feeding, poor soil to seed contact, or disease infection? Determine if the cause can be corrected to avoid a similar situation. If slug or insect feeding or disease is the cause, then you might expect poor stands again.
- Estimate the stand and percent stand loss due to gaps. Pace off the sections of row 20 paces long in at least 6 areas of the field. Determine (in number of paces) the total length of row lost to 2- to 3-foot gaps. For drilled soybean, this can be interpreted at 2- to 3-foot diameter gaps. Then determine the percent of row lost to gaps. In addition, count and determine average number of plants per foot in sections of row not reduced by gaps. The simplest method is to count the number of healthy plants (capable of recovery) in a length of row equaling 1/1000 of an acre. For instance:
- 36-inch rows = 14.5 feet
- 30-inch rows = 17.5 feet
- 20-inch rows = 26 feet
- 15-inch rows = 35 feet
- 7.5-inch rows = 70 feet
Then, just multiply your counts by 1,000 to get plants per acre.
Or, use the Tables 1 or 2 to determine remaining plant population. The “hula hoop” method (Table 2) is valuable with drilled soybean or when rows cannot be distinguished. This involves placing a circular measuring device such as a hula-hoop on the ground and counting the plants contained within.
| Table 1. Plant populations of different row spacing with different plant counts per foot. | ||||||
| Plants/ foot | Row Spacing | |||||
| 36 | 30 | 24 | 20 | 15 | 7.5 | |
| Plant Population (1,000’s/acre) | ||||||
| 1 | 15 | 17 | 22 | 26 | 35 | 70 |
| 2 | 29 | 35 | 44 | 52 | 70 | 140 |
| 3 | 44 | 52 | 65 | 78 | 105 | 210 |
| 4 | 58 | 70 | 87 | 105 | 139 | 278 |
| 5 | 73 | 87 | 109 | 131 | 174 | — |
| 6 | 87 | 105 | 131 | 157 | 209 | — |
| 7 | 102 | 122 | 152 | 183 | 244 | — |
| Table 2. Hula-hoop method for determining drilled soybean populations. | |||||
| No. ofPlants | Inside Diameter of Hula Hoop | ||||
| 30” | 32” | 34” | 36” | 38” | |
| Plant Population (1,000’s/acre)a | |||||
| 6 | 53 | 47 | 41 | 37 | 33 |
| 10 | 89 | 78 | 69 | 62 | 55 |
| 14 | 124 | 109 | 97 | 86 | 77 |
| 18 | 160 | 140 | 124 | 111 | 100 |
| 22 | 196 | 172 | 152 | 136 | 122 |
| 26 | 231 | 203 | 179 | 160 | 144 |
| aPlants/acre = no. plants ¸ (3.14 x r2 ¸ 43,560 ft2) where r = radius of hula hoop in feet. | |||||
- Estimate the yield of the poor stand. Use Tables 3 and 4 to determine percent of yield potential for full-season and double-crop plantings, respectively. Note that Table 3 is data from Illinois from the 1980’s. In my opinion, the remaining plant population numbers are too high. Although I have not conducted full-season plant population studies that have included gaps, I suggest that you change those numbers to 60, 90, and 120 (based on Virginia data). Multiply this percentage by the expected yield. This is the yield to expect from the deficient stand.
Table 3. Yield response (% of maximum) of full-season soybeans to deficit standsa. % Stand lost to gapsb Remaining Plant Pop (1,000’s/A) 70 105 140 0 95 97 100 10 93 96 98 20 91 93 96 30 88 90 93 40 83 86 89 50 78 81 84 60 73 75 78 aSource: Pepper and Wilmot. Managing Deficit Stands. 1991. Illinois Cooperative Extension Cir. 1317.bGaps of 12 inches or more; 30-inch rows Note that these data are from Virginia.
Table 13.4. Yield response (% of maximum) of double-crop soybeans to deficit standsa. % Standlost to gapsb Remaining Plant Pop (1,000’s/A) 100 140 180 220 0 80 88 95 100 20 71 79 86 91 40 61 69 76 81 60 48 57 64 69 aSource: 2001-2004 experiments, Suffolk, VA.bGaps of 3 feet; 15-inch rows; MG 4 variety - Estimate the yield from replanting. After mid-June, decrease the expected yields an additional half of a bushel per acre per day delay in planting. This is the yield to expect from delayed planting.
- Determine the gain or loss from replanting. Subtract the expected yield of the poor stand (step 3) from the yield expected from delayed planting. This is the gain or loss in bu/A from replanting. Multiply this number by the expected price ($/bu), using future prices, to obtain gain or loss in $/A.
- Estimate the cost of replanting. Include per acre cost of tillage, herbicide, fuel, seed, and labor.
- Determine profitability of replanting. Subtract your cost of replanting from your estimated gain from replanting.

