Tag Archives: plant population

Wet Soils, Poor Stands – Do I Replant?

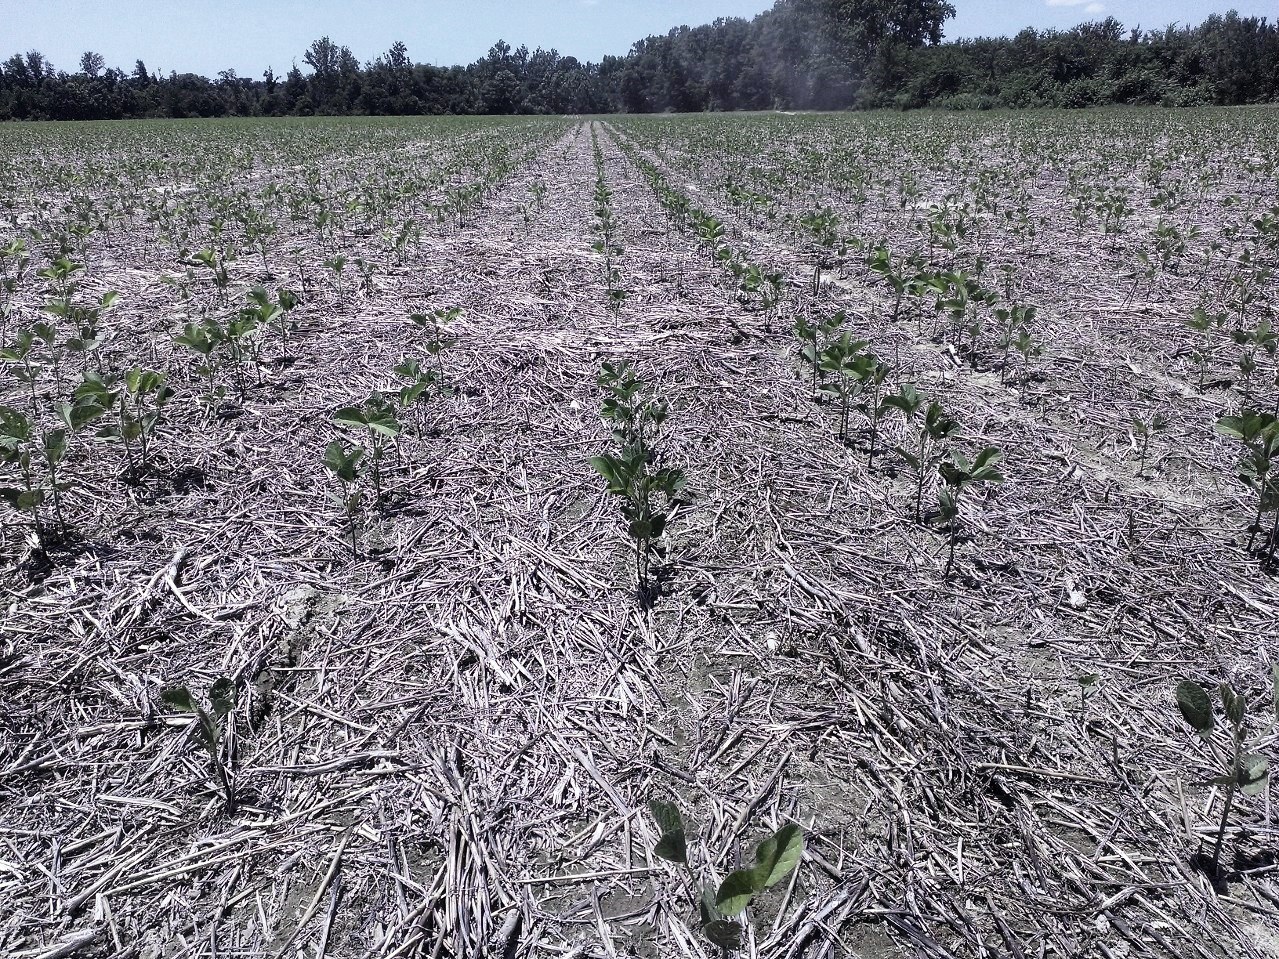
The decision of whether or not to replant arises every year; however, the wet soil conditions seem to have worsened the problem this year.  There of course will be areas that the decision is easy – flooded areas resulting in almost no stand.  But, what about fields that just are not living up to your expectations?  I’ve seen and heard many reports of stands being reduced 25 to 50% of what was expected (keep in mind that our expectations are sometimes too high).

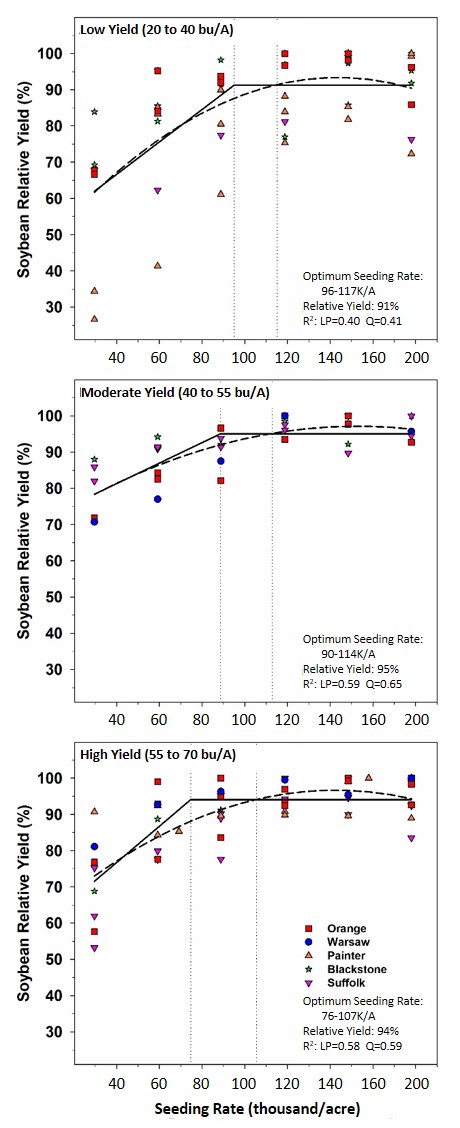
First, I must mention that final average stands of 60,000 to 80,000 plants/acre rarely profit from replanting.  Only when you get below 50,000 can it be economically justified.  I refer you to the seeding rate data shown.  Note that yield does not fall off until seeding rates fall below 90 to 120 thousand seed/acre (76 to 107 seed/acre on productive soils).  Stands generally averaged 75%; so, this is equal to  65 to 90 thousand plants/acre.  Once you add in the cost and of and time required to replant, it’s not usually worth it – unless the stand less than this.


Steps to Estimate the Profitability of Replanting Soybean

Determining whether or not to replant is hard.  To ease the pain, I’ve summarized some relatively simple steps to help in your decision.  One should incorporate 2- to 3-foot gaps into your decision to improve the estimation of yield loss.

  1. Determine the cause of the poor stand.  Was the poor stand the result of poor seed quality, cold wet soils, hot dry soils, planting too deep or shallow, soil crusting, herbicide injury, insect or slug feeding, poor soil to seed contact, or disease infection?  Determine if the cause can be corrected to avoid a similar situation.  If slug or insect feeding or disease is the cause, then you might expect poor stands again.
  2. Estimate the stand and percent stand loss due to gaps.  Pace off the sections of row 20 paces long in at least 6 areas of the field.  Determine (in number of paces) the total length of row lost to 2- to 3-foot gaps.  For drilled soybean, this can be interpreted at 2- to 3-foot diameter gaps.  Then determine the percent of row lost to gaps.  In addition, count and determine average number of plants per foot in sections of row not reduced by gaps.  The simplest method is to count the number of healthy plants (capable of recovery) in a length of row equaling 1/1000 of an acre.  For instance:
  • 36-inch rows = 14.5 feet
  • 30-inch rows = 17.5 feet
  • 20-inch rows = 26 feet
  • 15-inch rows = 35 feet
  • 7.5-inch rows = 70 feet

Then, just multiply your counts by 1,000 to get plants per acre.

Or, use the Tables 1 or 2 to determine remaining plant population.  The “hula hoop” method (Table 2) is valuable with drilled soybean or when rows cannot be distinguished.  This involves placing a circular measuring device such as a hula-hoop on the ground and counting the plants contained within.

Table 1. Plant populations of different row spacing with different plant counts per foot.
Plants/ foot Row Spacing
36 30 24 20 15 7.5
Plant Population (1,000’s/acre)
1 15 17 22 26 35 70
2 29 35 44 52 70 140
3 44 52 65 78 105 210
4 58 70 87 105 139 278
5 73 87 109 131 174
6 87 105 131 157 209
7 102 122 152 183 244
Table 2. Hula-hoop method for determining drilled soybean populations.
No. ofPlants Inside Diameter of Hula Hoop
30” 32” 34” 36” 38”
Plant Population (1,000’s/acre)a
6 53 47 41 37 33
10 89 78 69 62 55
14 124 109 97 86 77
18 160 140 124 111 100
22 196 172 152 136 122
26 231 203 179 160 144
aPlants/acre = no. plants ¸ (3.14 x r2 ¸ 43,560 ft2) where r = radius of hula hoop in feet.
  1. Estimate the yield of the poor stand.  Use Tables 3 and 4 to determine percent of yield potential for full-season and double-crop plantings, respectively.  Note that Table 3 is data from Illinois from the 1980’s. In my opinion, the remaining plant population numbers are too high.  Although I have not conducted full-season plant population studies that have included gaps, I suggest that you change those numbers to  60, 90, and 120 (based on Virginia data).  Multiply this percentage by the expected yield. This is the yield to expect from the deficient stand.
    Table 3. Yield response (% of maximum) of full-season soybeans to deficit standsa.
    % Stand lost to gapsb Remaining Plant Pop (1,000’s/A)
    70 105 140
    0 95 97 100
    10 93 96 98
    20 91 93 96
    30 88 90 93
    40 83 86 89
    50 78 81 84
    60 73 75 78
    aSource: Pepper and Wilmot.  Managing Deficit Stands. 1991. Illinois Cooperative Extension Cir. 1317.bGaps of 12 inches or more; 30-inch rows

    Note that these data are from Virginia.

    Table 13.4.  Yield response (% of maximum) of double-crop soybeans to deficit standsa.
    % Standlost to gapsb Remaining Plant Pop (1,000’s/A)
    100 140 180 220
    0 80 88 95 100
    20 71 79 86 91
    40 61 69 76 81
    60 48 57 64 69
    aSource: 2001-2004 experiments, Suffolk, VA.bGaps of 3 feet; 15-inch rows; MG 4 variety
  2. Estimate the yield from replanting.  After mid-June, decrease the expected yields an additional half of a bushel per acre per day delay in planting.  This is the yield to expect from delayed planting.
  3. Determine the gain or loss from replanting.  Subtract the expected yield of the poor stand (step 3) from the yield expected from delayed planting.  This is the gain or loss in bu/A from replanting.  Multiply this number by the expected price ($/bu), using future prices, to obtain gain or loss in $/A.
  4. Estimate the cost of replanting.  Include per acre cost of tillage, herbicide, fuel, seed, and labor.
  5. Determine profitability of replanting.  Subtract your cost of replanting from your estimated gain from replanting.


Soybean Seeding rates for June and Later

Due to the rainy weather over the past two weeks, we are still planting full-season soybean in some areas.  In addition, it appears that wheat harvest is not far off (some wheat at the Tidewater AREC was at 23% moisture today!).  So, should we be increasing our seeding rates?

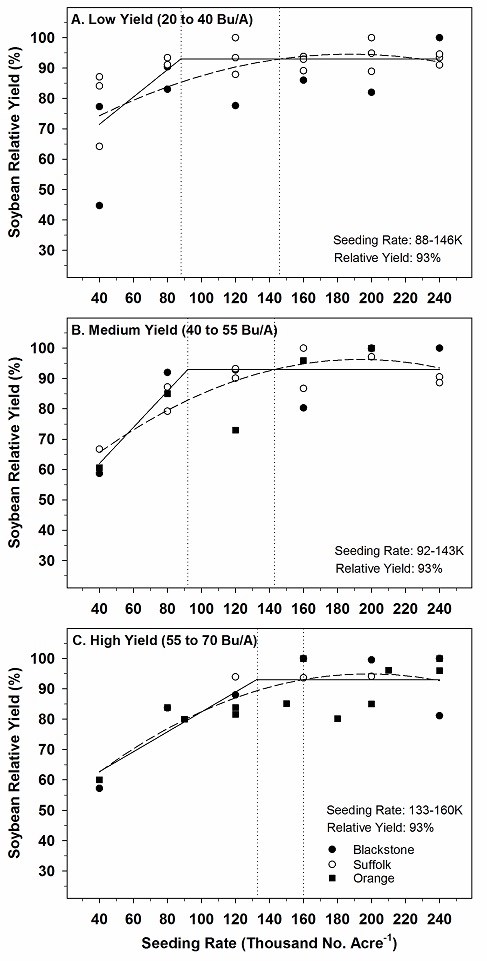
In general, yes.  But, big increases probably will not be needed until late-June.  Below are some seeding rate data that we collected from soybean planted in early-June after barley.  First, we don’t have a lot of data of soybean grown after barley, so I don’t have as much confidence in the exact seeding rate needed.  Note that there is a wide range in the optimal seeding rates, illustrated by the area between the dotted lines in the graph.  Although, these data may not directly apply to full-season soybean (no small grain), it should be close.

I think that we should now be using 120,000 to 160,000 seed/acre.  The range will depend on the planting date.  In general, I’d suggest bumping up your seeding by 20-30,000 seed/acre per week through June.

If you remember the seeding rate data that I shared in this blog last month for May-planted soybean (see Soybean Seeding Rates – How Low Can We Go?), I stated that maximum yields could be obtained with only 95,000 to 110,000 seed/acre when the yield potential is greater than 40 bushels/acre.  That’s pretty low, but was adequate for maximum yield under good growth conditions.  For less than 40 bushel potential, seeding rates needed to be a little higher.   In the above graph, it appears that more seed is needed to obtain 55 to 70 bushels/acre after barley, I cannot fully explain why; therefore, I would assume that this response is primarily due to the location that we obtained the data (again, we don’t have a lot of data).

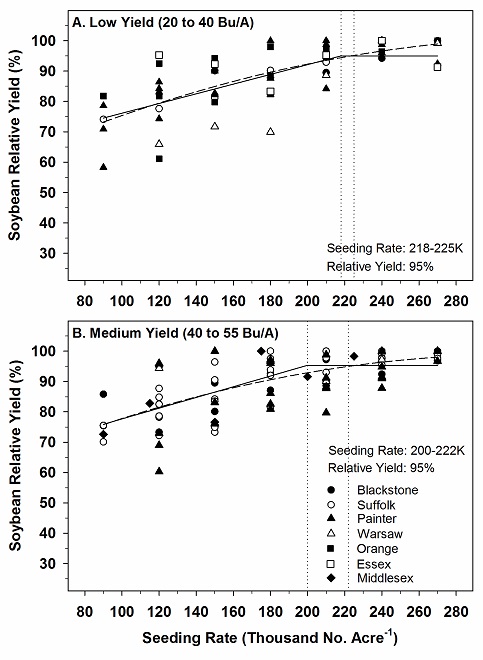
Once we get into mid- to late-June, I’d rather see a seeding rate of 180,000 to 220,000 seed/acre, depending on planting date.  This is based on the data to the right.    You’ll notice that, like full-season soybean, the optimal seeding rate falls with greater yields.  This is most likely due to greater leaf area with those high-yielding locations.  As I’ve stated often, the seeding rate response can usually be traced back to whether or not the crop developed enough leaf area to capture 90-95% of the light by early pod development.  Unfortunately, I don’t have any double-crop data planted following wheat with yields greater than 55 bushels/acre.  I hope to solve that problem this year with new experiments.

Soybean Seeding Rates – How Low Can We Go?

It seems that everything that you read about soybean seeding rates is that we are planting too many seed.  In general, I agree – at least for full-season soybean.  We still seem to have that mindset that it takes 1 bag of seed per acre.  But many of you have been listening and are taking the seeding rate down to 100,000 to 120,000 seed per acre, with no noticeable difference in yield.   But, can you go lower?  And how low can you go?

To help answer this question, we have re-analyzed about 10 years of data that we collected from dozens of experiments conducted from 2003 through 2011.  But instead of just looking at average yield response, we separated these responses into soybean yield potentials.

Why did we do this?  I’ve always thought that more seed is needed to maximize yield on low-yielding fields (or portions of fields) and less seed are needed or high-yielding fields or portions of fields.  Yes, this means that I’m asking you to spend more money on the least profitable fields and less money on the most profitable fields.  Still, this strategy will likely be more profitable over all acres.

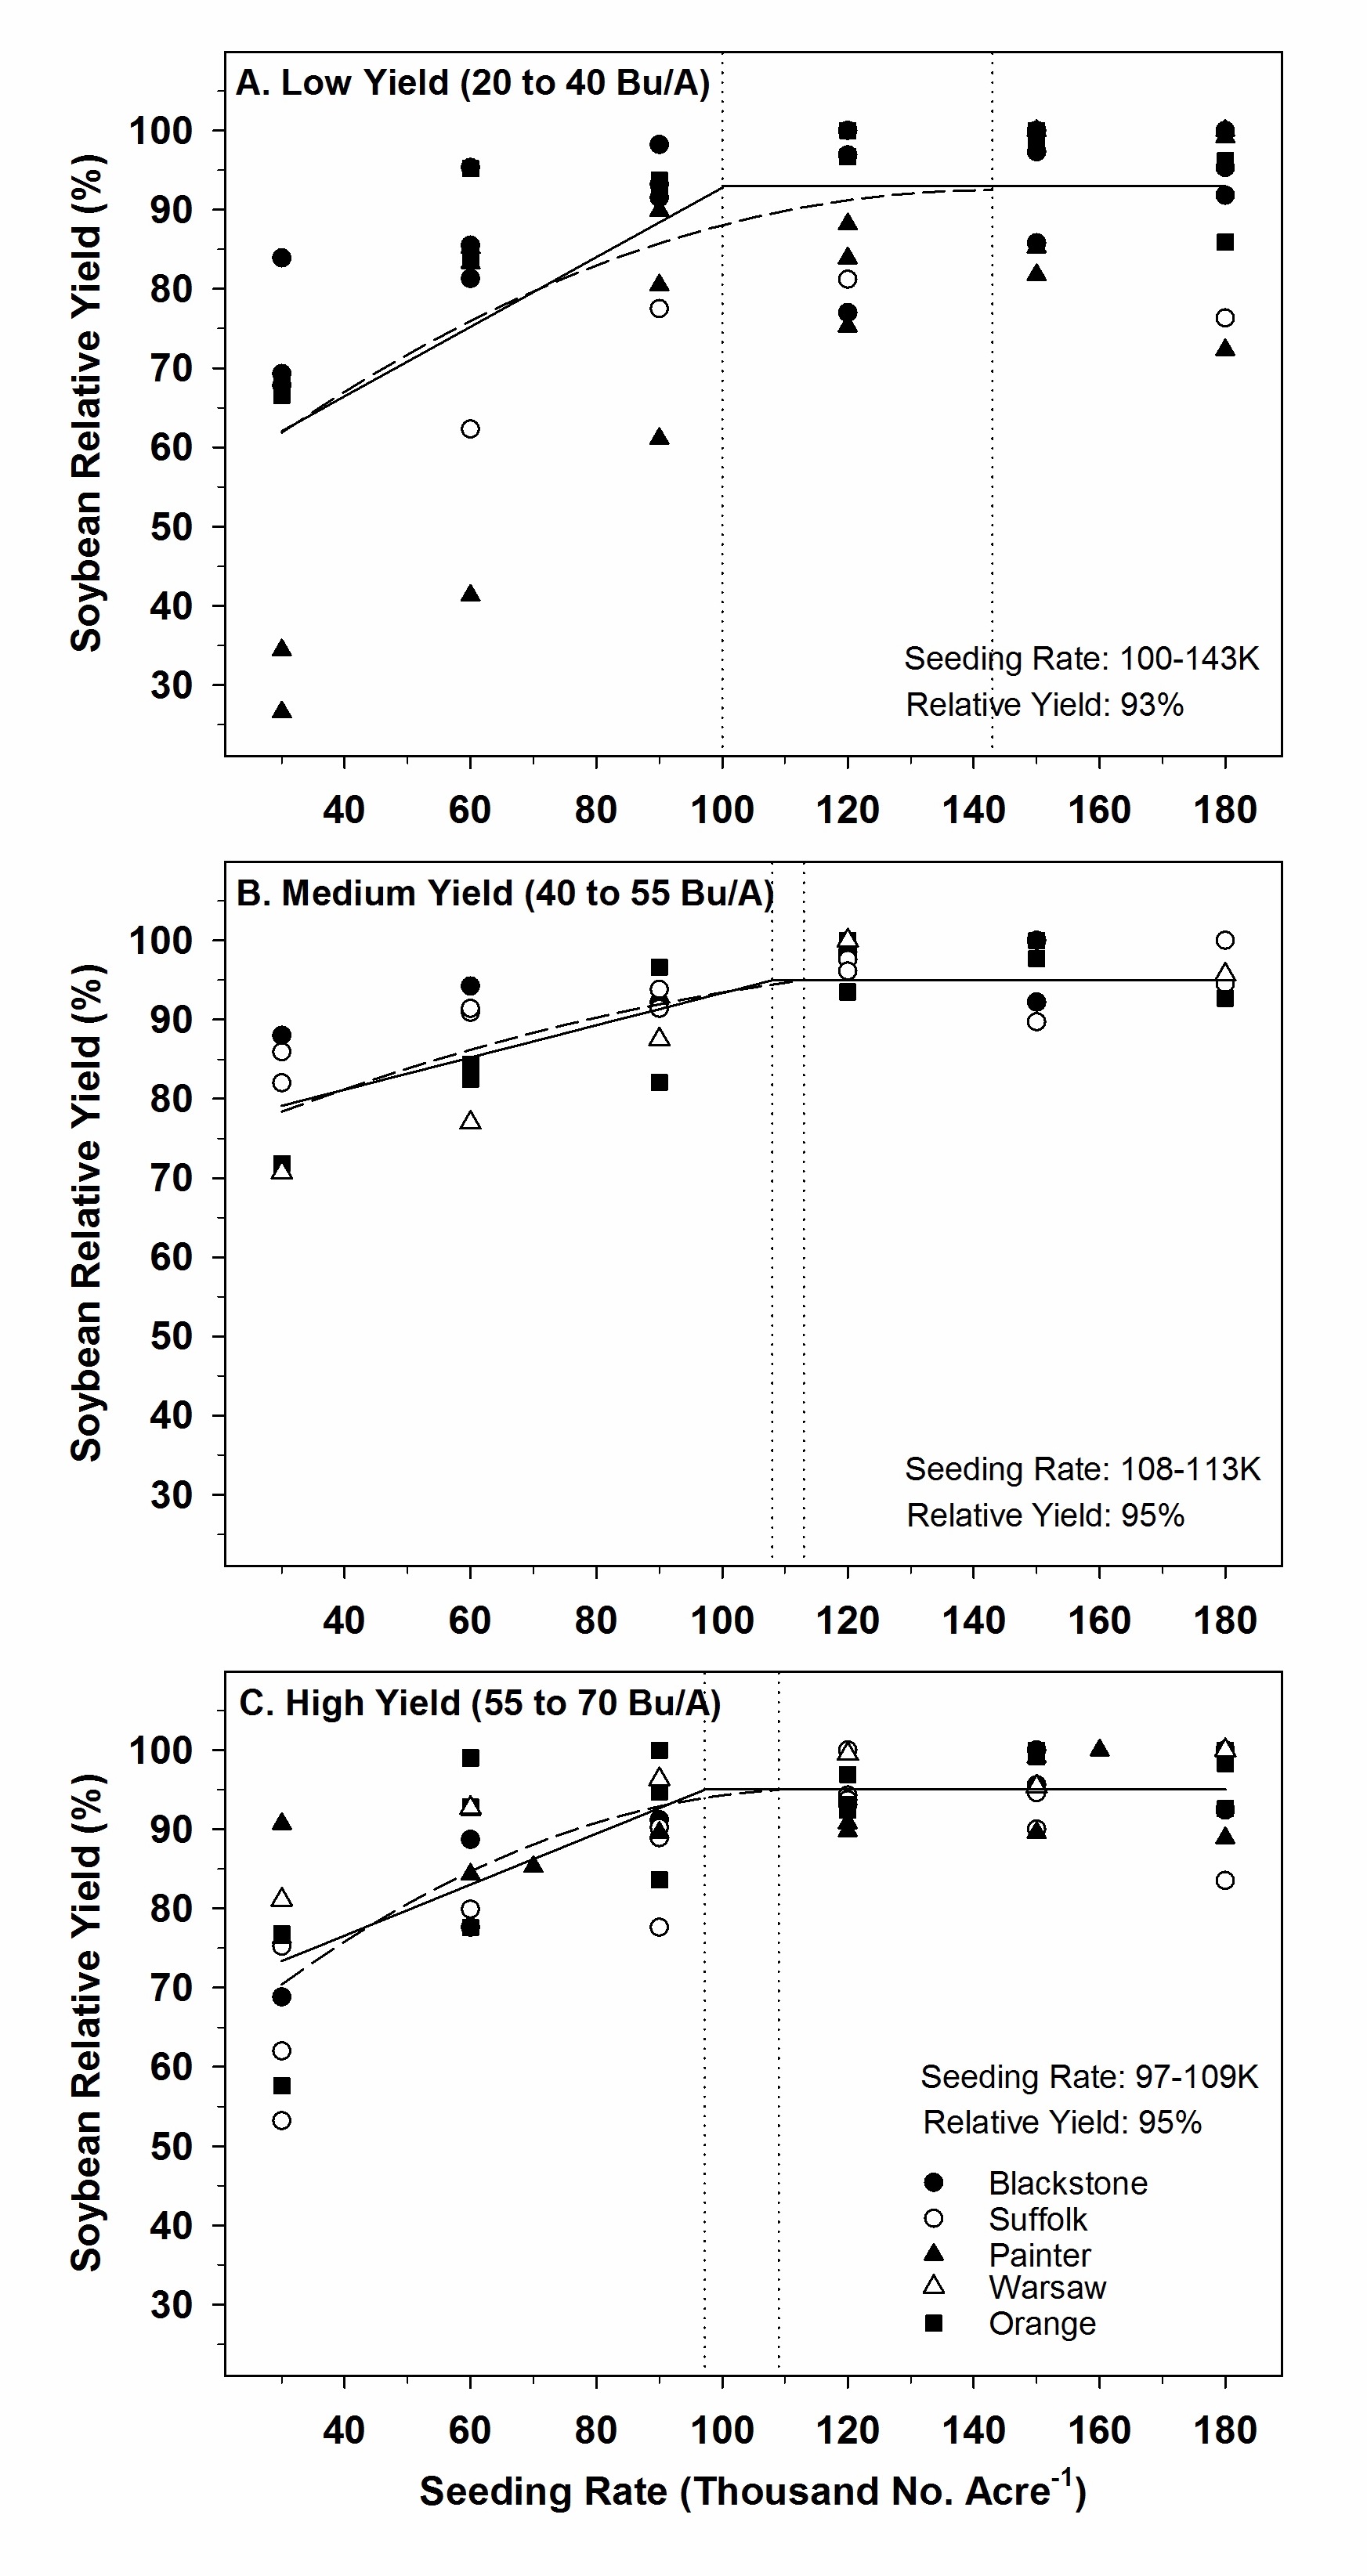
There are a few things worth noting about the graphs to the left.  First, I’ve separated the data into low (20-40 Bu/A), medium (40-55 Bu/A), and high (55-70 Bu/A) groupings.  We decided on these levels by analyzing the data over and over at many different yield levels.  The resulting three levels were most stable and predictive.

Second, we used two statistical methods to fit a curve to the data to intentionally give us a range of seeding rates needed to maximize yield.  This allow us to recognize the variability in the data and reflects our confidence in the response.  Pay particular attention to the wide range of seeding rates necessary to maximize yield at the 20 to 35 bushel yield potential.  This reflects the yield variability and the variability in the response of yield to seeding rates that are common in low-yielding years or fields.  We just are not as confident in this set of data.  Some years or locations, we could get by with 100,000 seed/acre; in others, it took more than 140,000.  With the other yield potentials, the range is pretty tight.  In other words, I have more confidence in recommending 110,000 or even less than 100,000 seed/acre in these instances.

Finally, we see that it takes, in general, less seed at high yields – which verifies my earlier statement that less seed are needed for higher yield potentials.

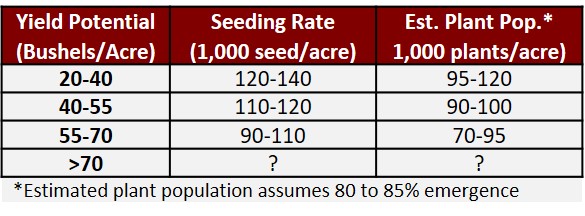
So what have I settled on?  Below are my suggestions.

But, you may ask, “What about yields greater than 70 bushels per acre?  That’s a good question.  But, I cannot answer it confidently since we have little data in that range.  We are however conducting new experiments this summer to update our data.

But until that data is available, here are my thoughts.  I think that lower seeding rates will work until you get to the 100+ bushel yield range.  After that, I suspect that we are running low on reproductive nodes (node on the plant where pods can form).  For instance, if we only have 80,000 plants/acre, we would need 15 reproductive nodes containing 4 pods on every one of these nodes!  While this is possible, I’m assuming in this calculation that we will grow 2,500 seed/pound and 3.0 seed/pod. Taking that down to a more normal 2800 seed/pound and 2.5 seed/pod, that means we need 6 pods per node!  I think that we are starting the expect a little much from single plant in this case.

So, for 100+ bushel yield environments, I’d suggest to gradually increase your seeding rate from the ones suggested above.  I do understand that we have very few 100+ bushels fields, but I have seen parts of the field exceeding this when I’m watching a yield monitor.   An we commonly have plots within our small-plot tests exceeding 90 and 100 bushels.

Finally, am I suggesting that we may be able to vary our soybean seeding rate as we do corn?  Yes, I’m suggesting that.  We will be validating some variable-rate-seeding (VRS) on two farmer’s fields this year.  If you know of anyone who has VRS planters and who would like to participate in an on-farm test, let me know.

Soybean Replant Decisions

Deciding whether or not to replant can be a gut-retching decision.  I readily admit that the choice to leave the present stand or replant is not a simple one.  With the cost of seed and diesel fuel, the profitability of replanting may not seem a good idea.  Low prices make this no more appealing.  In the end, your decision should be one based on the estimated dollar gain from replanting.  This will require a careful evaluation of the soybean stand and an analysis of yield potential of the present and replanted crop.

In general, there is less benefit of replanting if stands are reduced uniformly across the field.  Usually replanting can only be justified where stands have been reduced by half.  However, poor stands usually include gaps in addition to merely a lower plant population.  These gaps must be accounted for.  In addition, one may have a 75-80% stand in parts of the field, while other parts of the field may only have 20-25% of the intended plant population; the decision may be to only replant part of the field.

Remember to take into account the yield loss from delayed planting.  Up until mid-June, there is very little yield loss from delayed planting.  After this, for every day delay in planting yield declines about half a bushel per day.  For instance, if replanting in late-June/early-July (about 2 weeks late), your potential yield will have declined by 7 bushels per acre.

A few more questions must be asked before we can proceed with a step-by-step procedure for estimating the profit of replanting.  When considering a replant, do you leave plants in the field and plant through them?  In many cases, planting through the poor stand is a possibility.  If you’re using rows wide enough to fit a tractor tire comfortably between them, then you can split the rows and plant enough new plants to get the final plant population up to 100 to 120 thousand plants for full-season systems (if re-planting before mid-June) or 180 to 200 thousand plants per acre for double-cropped systems (this may require equipment or tractor tire modifications).

On the other hand, a drill will cut up many healthy plants and make them less productive than the ones that you just replanted.  Also, if the drill has wide gauge wheels, then you can severely damage a significant number of plants (there’s a significant amount of down pressure on those wheels – enough to crush a plant on hard soil).  And a damaged plant can sometimes act more like a weed than a crop.  Recognize that the plants growing in the field are going to be higher yielding that any that emerges after replanting.  If you destroy or injure those plants, you’ve just writing off some profit.  Therefore, I do not suggest planting through the old stand with a drill.

Another issue is that if you decide to replant, do you switch to an earlier maturity group?  There is little need to plant an earlier-maturing variety.  Here are two general rules of thumbs:

April/May Plantings:  A 3-day delay in planting will result in a 1-day delay in planting.  Therefore, if planting 30 days later, the crop will mature 10 days later.

June/July Plantings:  A 5-day delay in planting will result in a 1-day delay in maturity.  Therefore, if planting 15 days later, the crop will mature only about 3 days later.

Most important is to plant a maturity group that would grow as long as possible (therefore producing an adequate canopy for maximum yield) and still mature before the average frost date.  If you’re destroying the old crop and starting over, just make sure that the variety you chose will mature before a frost.  Alternatively, if you are planting into the old crop, you may want to choose a variety about one-third to half a maturity group earlier (depending on planting date differences) so that harvest maturity of both plantings will be more in sync.  For example, if you planted a relative maturity group 5.6 on June 10, then you could choose a relative maturity of 5.2 to 5.4 if replanting on June 25.

Finally, realize that you’ll need a higher plant population when planting late.  Final stand with a double-crop planting should be at least 180 thousand plants per acre.  If replanting in July, increase the seeding rate to insure at least 220 thousand plants per acre.

To estimate the profitability of replanting, follow the guidelines listed below.  Be sure to incorporate plant population and gaps in your calculations.  We’ve found that 2- to 3-foot gaps cause as much or more yield loss that from low plant populations.

  1. Determine the cause of the poor stand.  Was the poor stand the result of poor seed quality, cold wet soils, hot dry soils, planting too deep or shallow, soil crusting, herbicide injury, insect or slug feeding, poor soil to seed contact, or disease infection?  Determine if the cause can be corrected to avoid a similar situation.  If slug or insect feeding or disease is the cause, then you might expect poor stands again.
  2. Estimate the stand and percent stand loss due to gaps.  Pace off the sections of row 20 paces long in at least 6 areas of the field.  Determine (in number of paces) the total length of row lost to 2- to 3-foot gaps.  For drilled soybean, this can be interpreted at 2- to 3-foot diameter gaps.  Then determine the percent of row lost to gaps.  In addition, count and determine average number of plants per foot in sections of row not reduced by gaps.  The simplest method is to count the number of healthy plants (capable of recovery) in a length of row equaling 1/1000 of an acre.  For instance:
  • 36-inch rows = 14.5 feet
  • 30-inch rows = 17.5 feet
  • 20-inch rows = 26 feet
  • 15-inch rows = 35 feet
  • 7.5-inch rows = 70 feet

Then, just multiply your counts by 1,000 to get plants per acre.

Or, use the Tables 1 or 2 to determine remaining plant population.  The “hula hoop” method (Table 2) is valuable with drilled soybean or when rows cannot be distinguished.  This involves placing a circular measuring device such as a hula-hoop on the ground and counting the plants contained within.

Table 1. Plant populations of different row spacing with different plant counts per foot.
Plants/ foot Row Spacing
36 30 24 20 15 7.5
Plant Population (1,000’s/acre)
1 15 17 22 26 35 70
2 29 35 44 52 70 140
3 44 52 65 78 105 210
4 58 70 87 105 139 278
5 73 87 109 131 174
6 87 105 131 157 209
7 102 122 152 183 244
Table 2. Hula-hoop method for determining drilled soybean populations.
No. ofPlants Inside Diameter of Hula Hoop
30” 32” 34” 36” 38”
Plant Population (1,000’s/acre)a
6 53 47 41 37 33
10 89 78 69 62 55
14 124 109 97 86 77
18 160 140 124 111 100
22 196 172 152 136 122
26 231 203 179 160 144
aPlants/acre = no. plants ¸ (3.14 x r2 ¸ 43,560 ft2) where r = radius of hula hoop in feet.


  1. Estimate the yield of the poor stand.  Use Tables 3 and 4 to determine percent of yield potential for full-season and double-crop plantings, respectively.  Multiply this percentage by the expected yield. This is the yield to expect from the deficient stand.
    Table 3. Yield response (% of maximum) of full-season soybeans to deficit standsa.
    % Stand lost to gapsb Remaining Plant Pop (1,000’s/A)
    70 105 140
    0 95 97 100
    10 93 96 98
    20 91 93 96
    30 88 90 93
    40 83 86 89
    50 78 81 84
    60 73 75 78
    aSource: Pepper and Wilmot.  Managing Deficit Stands. 1991. Illinois Cooperative Extension Cir. 1317.bGaps of 12 inches or more; 30-inch rows


    Table 13.4.  Yield response (% of maximum) of double-crop soybeans to deficit standsa.
    % Standlost to gapsb Remaining Plant Pop (1,000’s/A)
    100 140 180 220
    0 80 88 95 100
    20 71 79 86 91
    40 61 69 76 81
    60 48 57 64 69
    aSource: 2001-2004 experiments, Suffolk, VA.bGaps of 3 feet; 15-inch rows; MG 4 variety
  2. Estimate the yield from replanting.  After mid-June, decrease the expected yields an additional half of a bushel per acre per day delay in planting.  This is the yield to expect from delayed planting.
  3. Determine the gain or loss from replanting.  Subtract the expected yield of the poor stand (step 3) from the yield expected from delayed planting.  This is the gain or loss in bu/A from replanting.  Multiply this number by the expected price ($/bu), using future prices, to obtain gain or loss in $/A.
  4. Estimate the cost of replanting.  Include per acre cost of tillage, herbicide, fuel, seed, and labor.
  5. Determine profitability of replanting.  Subtract your cost of replanting from your estimated gain from replanting.


It’s Time to Start Increasing Soybean Seeding Rates

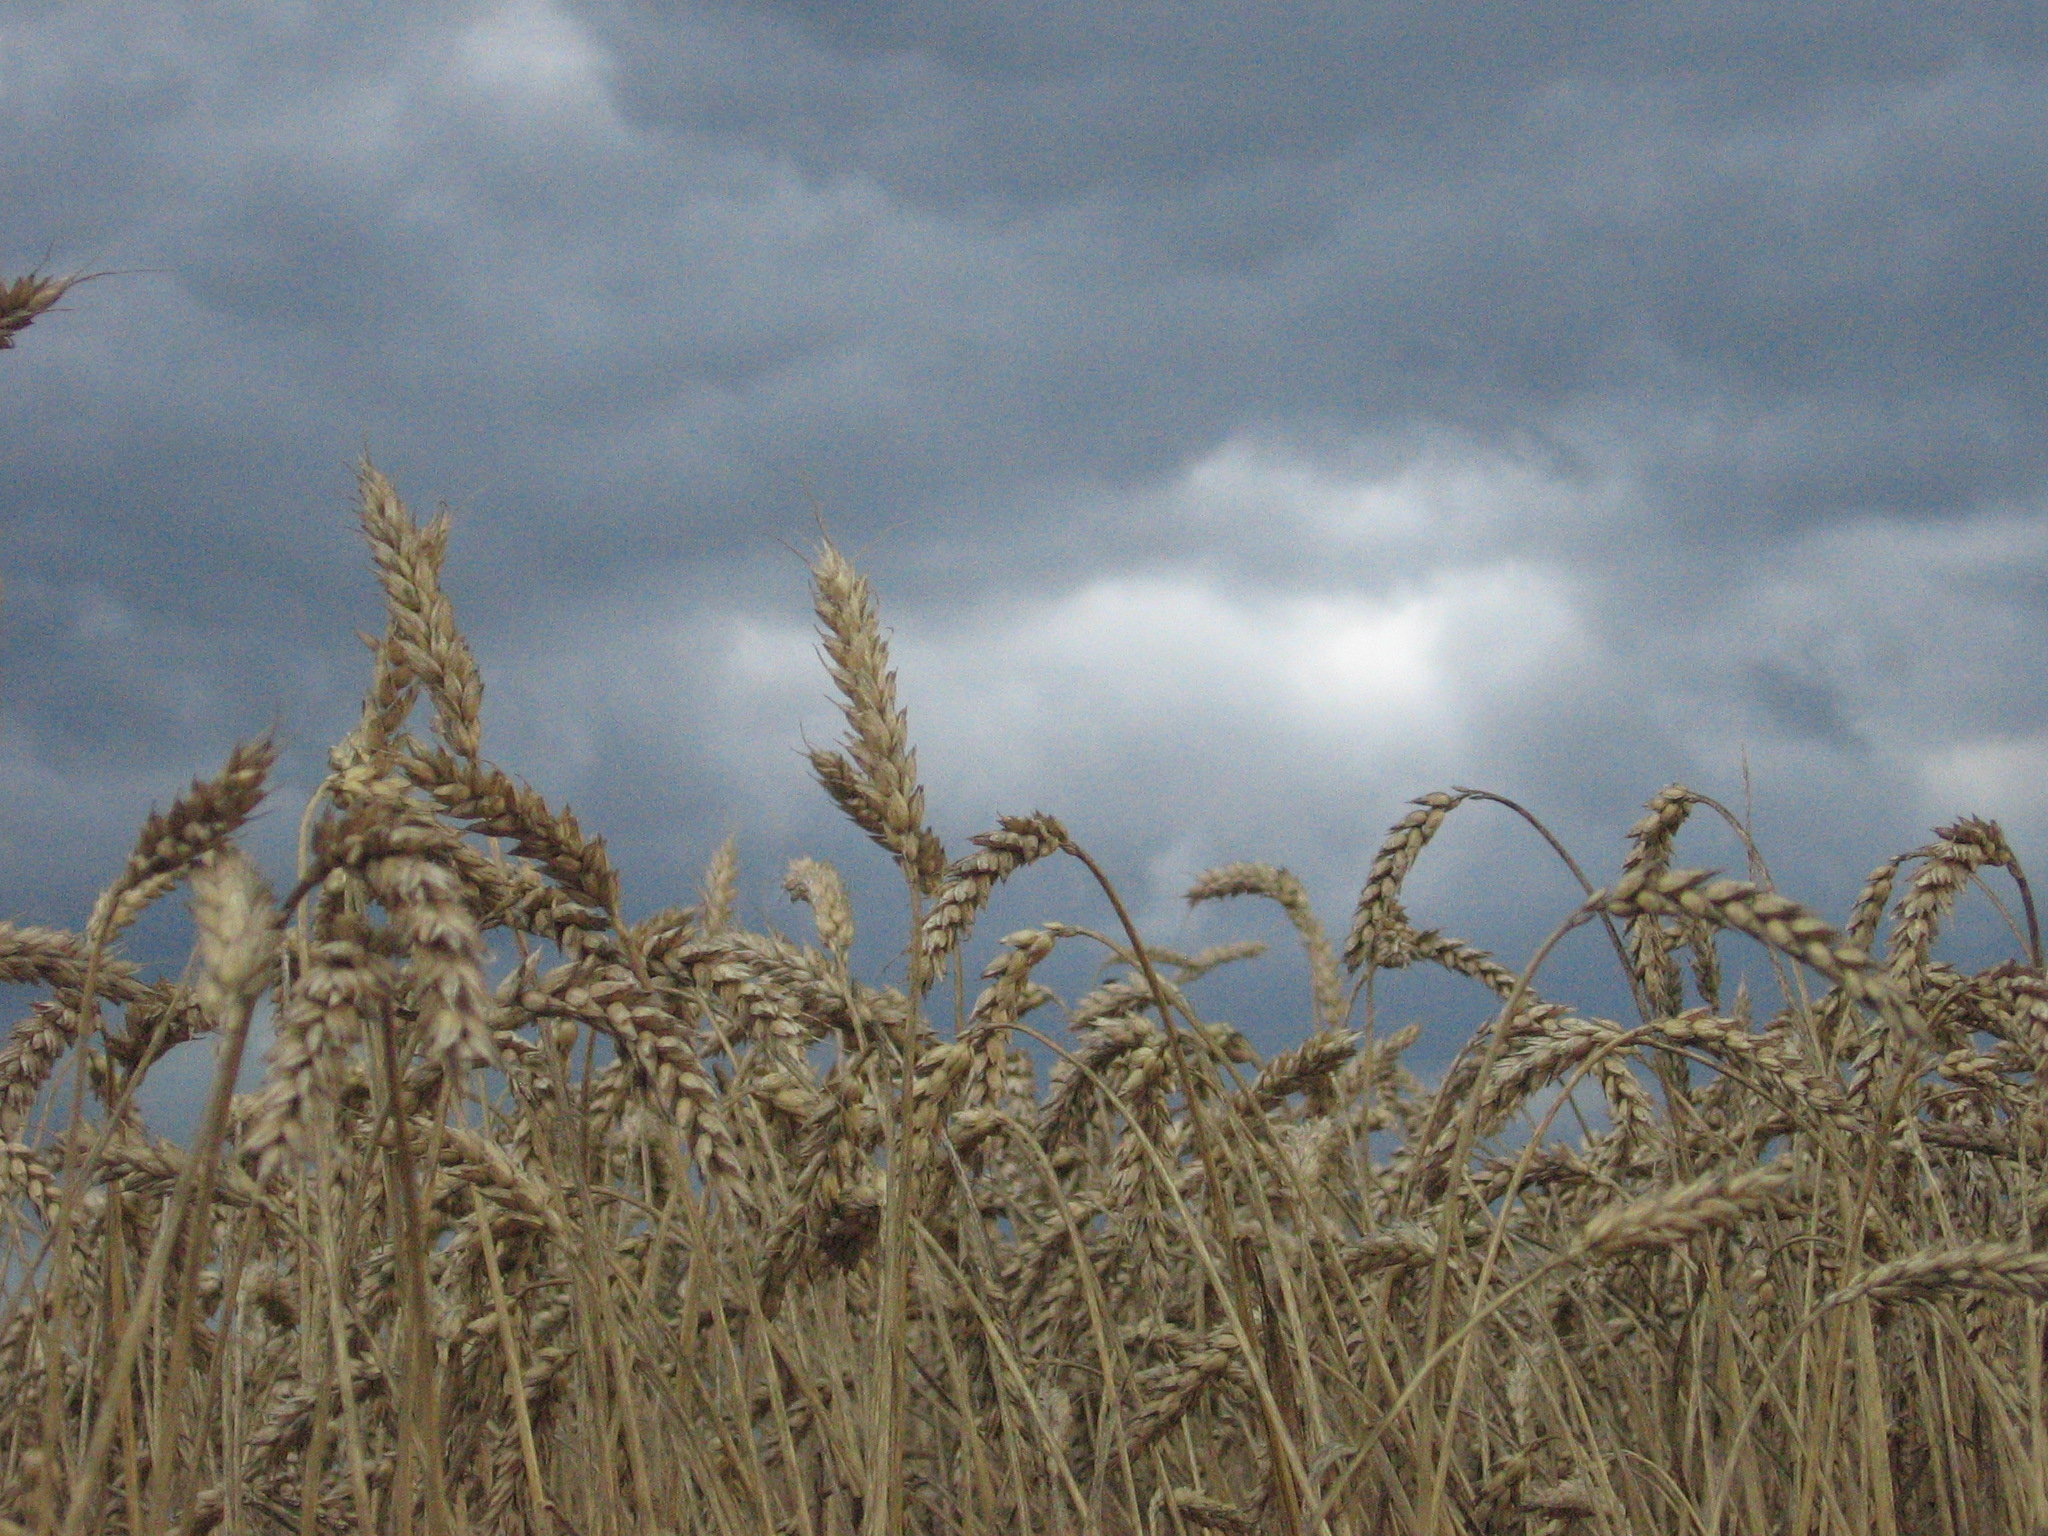
Mature wheatSmall grains are maturing rapidly and soybean planting will soon follow.  While there is little benefit to having more than 70 to 80 thousand uniformly-spaced soybean plants per acre when planted in May, more plants will be needed to maximize yield potential as planting date is delayed later into June.  My general seeding rate recommendations (seed per foot, depending on row spacing) are listed in the table below.  Suggested Soybean Seeding Rate TableNote that I give a range for full-season, double-crop after barley, and double-crop after wheat.  The range represents how the optimal seeding rate will vary depending on yield potential (determined largely by soil type and weather), planting date, and uniform spacing.  With soybean, greater yield potential usually means that lower seeding rates can be used (opposite from corn).  This basically reflects the capacity of the soil to produce more-than-adequate leaf area to fill in relatively wide spacing and/or gaps between plants within a row.  If it’s a productive soil (good plant-available water-holding capacity and good fertility), early plant growth will generally be greater due to lack of stress.  In contrast, if the soil is not as productive, stress may prevent soybean from filling in gaps within and between rows as quickly; therefore, more plants per acre are needed.
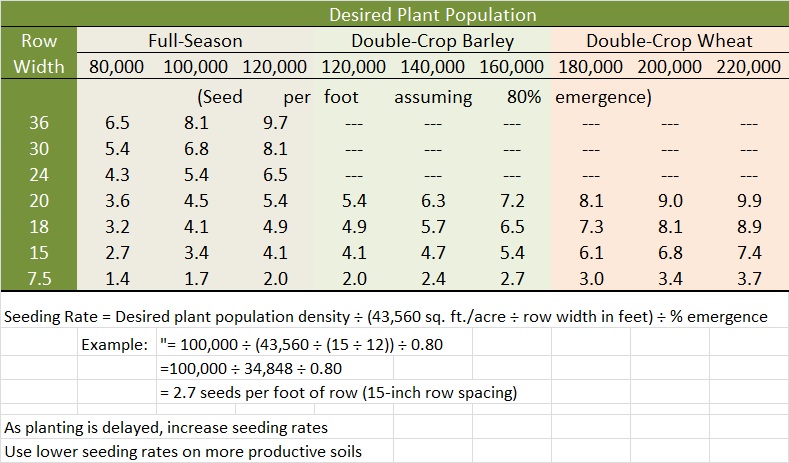
Secondly, as planting is delayed, greater seeding rates are needed to make up for the lost time.  Although this is not a big factor until the second or third week of June, yield falls rapidly afterwards, on average about 1/2 bushel per acre per day delay in planting.  More seed per acre will make up for much of this yield loss.

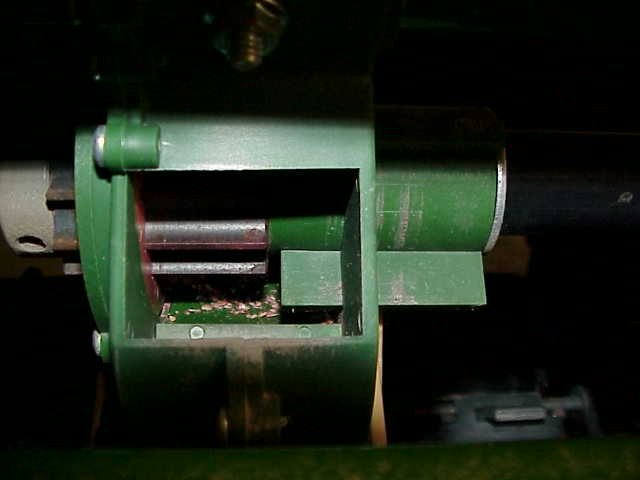
Finally, note that I stated “uniformly-spaced” plants.  Many drills are just pushing seed out a small opening GP1200 Drill Seed Feed Back View Closeand this seed then bounces to and fro within a long tube (this is sometimes referred to as a “controlled spill”).  Without a metering system near the disk opener, this will result in a stand that is far from being uniform – it’s over-planted in some areas, it’s under-planted in others).  Therefore, I lean towards the higher seeding rates with planted with a drill that does not meter the seed.

So, where are we today?  I lean towards planting around 150 to 180 thousand seed per acre (to give 120 to 140 thousand plants per acre).  You should begin to slowly bump up that seeding rate as we near the end of June.  We have conducted numerous double-crop soybean experiments over the years.  Our data indicate that, in most cases, we need 180,000 plants per acre by the end of June in order to maximize our yield.

Although these seeding rate recommendations are based on lots of data, only the growing season will determine if we chose the correct rate.  If we have plenty of sun and rain, little to no plant stress, and excellent early-season vegetative growth, these seeding rates will be too high.  But if the opposite occurs, we’ll need all the plants that we can fit into a field.