Category Archives: Commodity

What’s the Best Soybean Maturity Group for your Farm

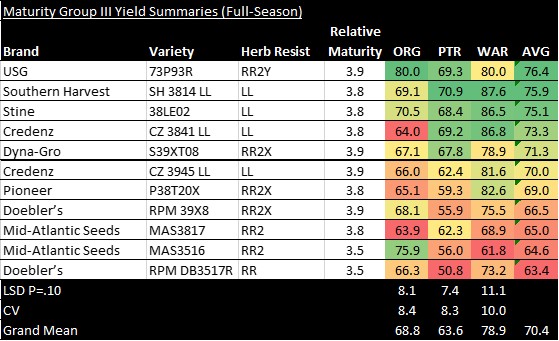
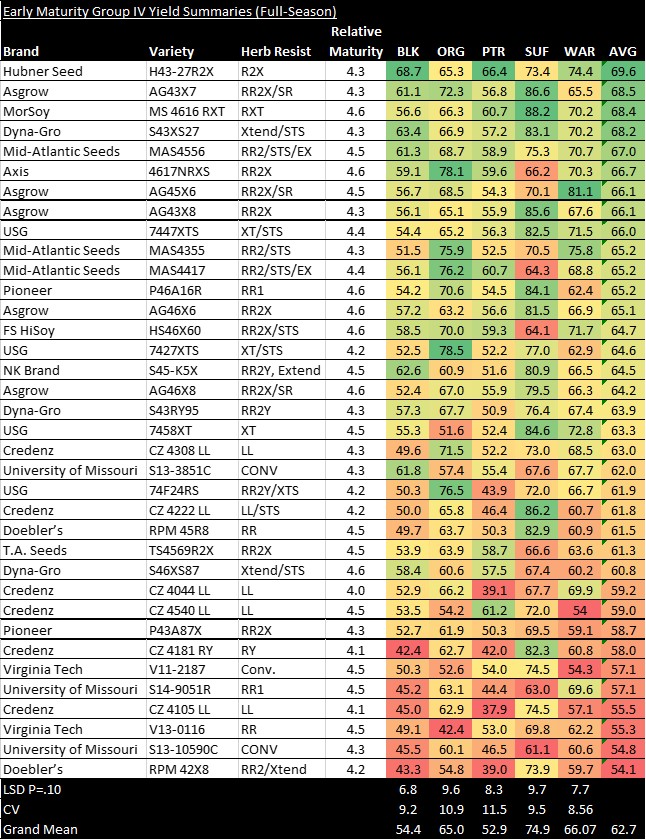
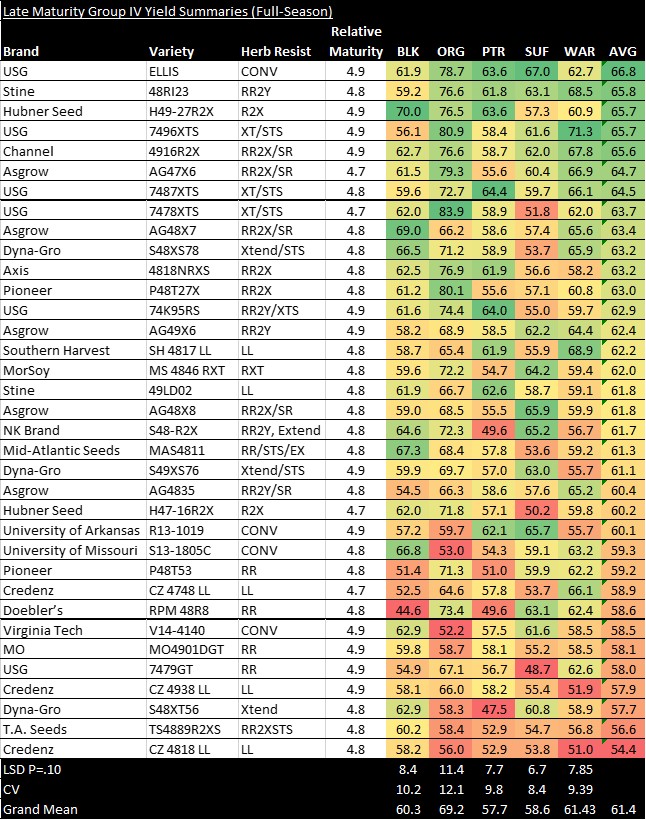
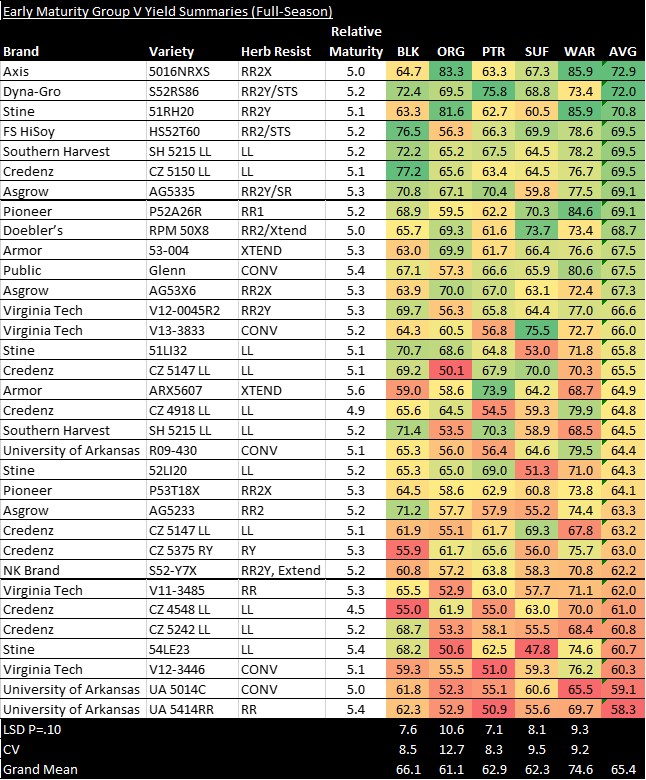
Yields are coming in from our variety tests – yields are good, not great, but good, ranging from the upper 40’s to low 70’s.  I hope to get a summary of the maturity group (MG) 3 and 4 tests out soon.  Be looking for them.

In the meantime, a questions that continues to arise if “What is the best maturity group for my farm?”  Or “What’s the best maturity group for my field?”  This is a very valid question.  Some years MG 4’s will shine and other years the MG 5’s are best.  Occasionally, MG 3 or 6 look good (the 6’s have been performing very well lately – as long as the frost holds off until mid-Nov!

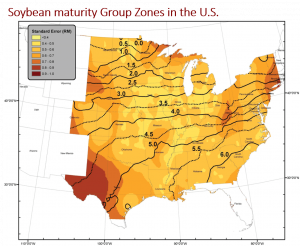
An attempt was recently made (and published) to redrawn the MG lines in the U.S (Mourtzinis and Conley, 2017) – see the map to the upper right.  The researchers used variety test data from nearly all states to come up with the map shown.  While this map is more-or-less accurate when looking at the U.S. as a whole, it is not when you look closer (i.e., at individual states).

To better answer your questions regarding MG’s in Virginia, we took 10 years of our variety test data (around 15,000 plots) and began evaluating the probability of:

  1. a relative maturity (RM) yielding at least as high as the other RM’s tested at that location
  2. a RM yielding significantly higher than the other RM’s tested at that location.

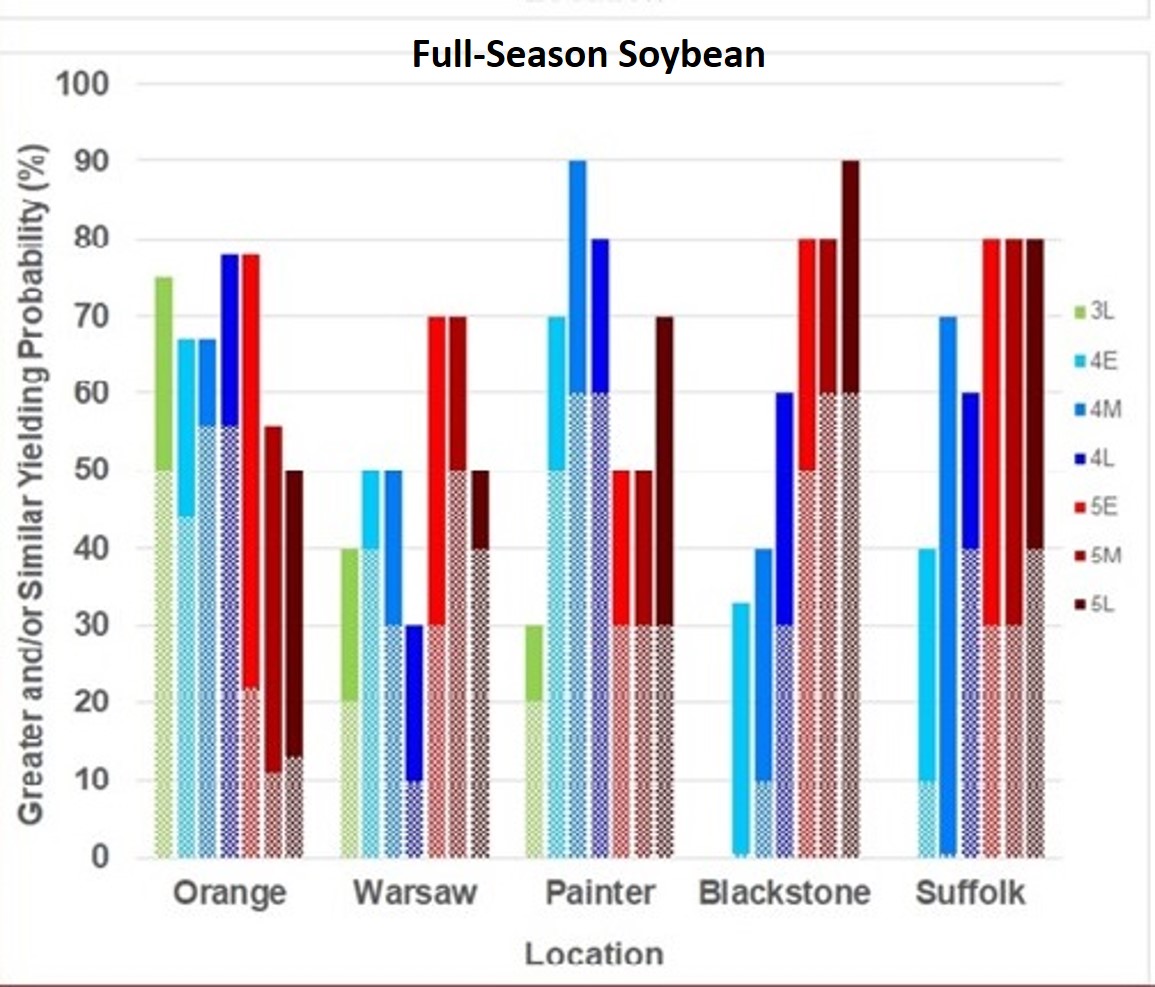
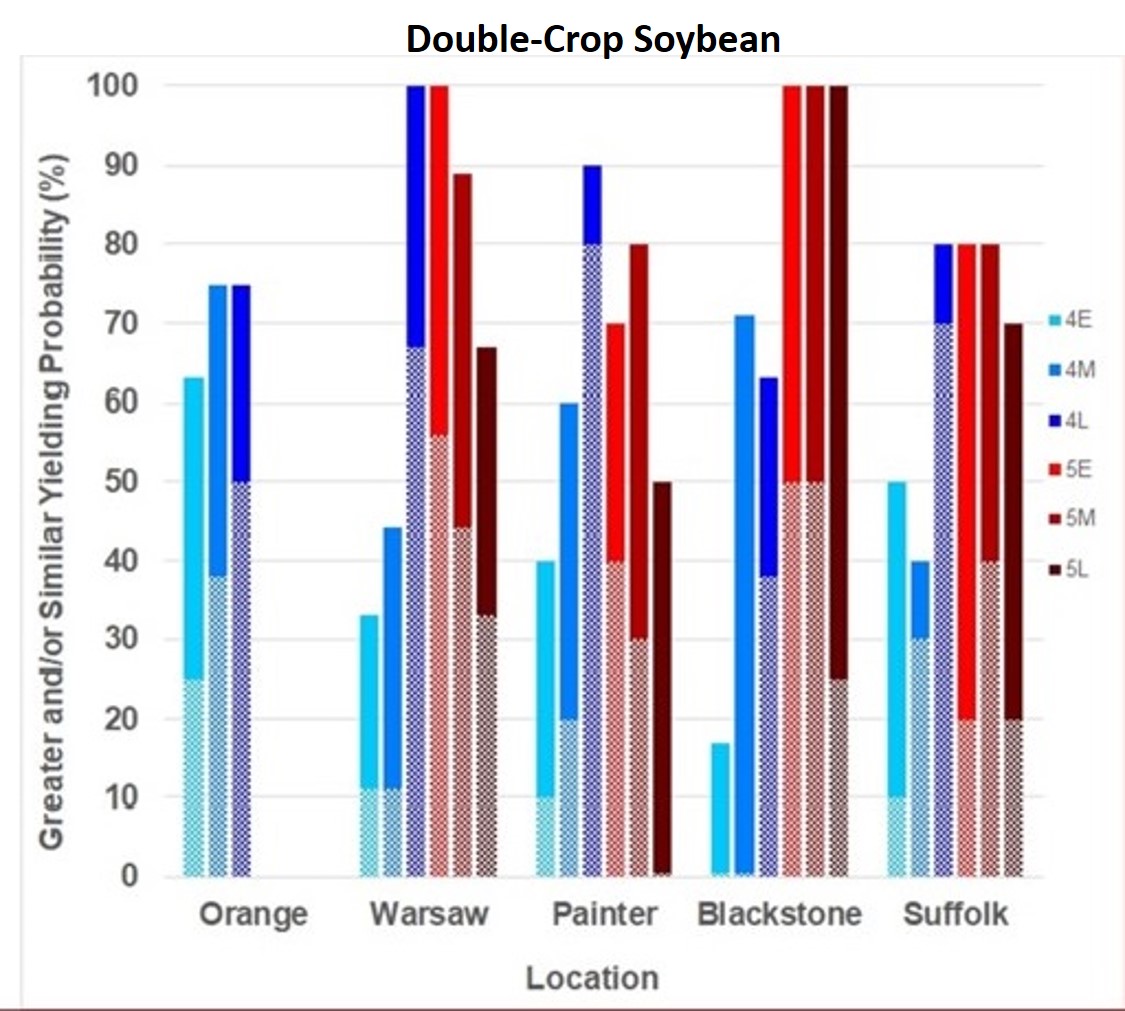
Results are shown in the following graphs. Note that we split the results into full-season and double-crop soybean.  We have also divided each MG into early-, mid-, and late-RM’s.  The total bar height answers question 1 – the probability that the RM does at least as well at the others.  For instance, as expected, there is an 80 to 100% probability that MG 5’s will yield at least as much as other relative maturities in Blackstone (Southern Piedmont, droughty clay soils).

The hatched part of the bars answer question 2 – the probability that the RM yields significantly more that the other RM’s.  Using the Blackstone example, the 5’s yield significantly more than other MG’s 30 to 60% of the time.

Of course the “devil is in the details”.  There are soil properties and environmental conditions that control which RM is best in a given year.  If interested, contact me; I’ll give you my preliminary thoughts on that.  Rainfall is definitely the biggest influence – not how much we receive but when it falls; but that is random in Virginia.  There are other issues.


To summarize:

  • MG 3’s and 4’s are best suited for the most northern and western location (Orange).
  • MG 5’s perform best in our most southerly locations (Blackstone and Suffolk).  But, the late 4’s can make a strong showing in some years, especially at Suffolk (I think I know why; its not just when the rain fell. Contact me.)
  • Both MG 4’s and 5’s perform well at Warsaw (we can’t explain the full-season late-4 results, yet).  Note that yield potential of the later 5’s decline with double-crop plantings at this northerly, but Coastal Plain site (probably frost damage).
  • All MG 4’s (early, mid, and late) perform best when planted in May at our Eastern Shore location (Painter).  There are curious things happening here (while not that far south, its our most easterly and probably the most consistently favorable environment for growing soybean).  Note that early- and mid-4’s are no better than 5’s when planted double-crop.

1st Attempt at a Relative Maturity Map in Virginia

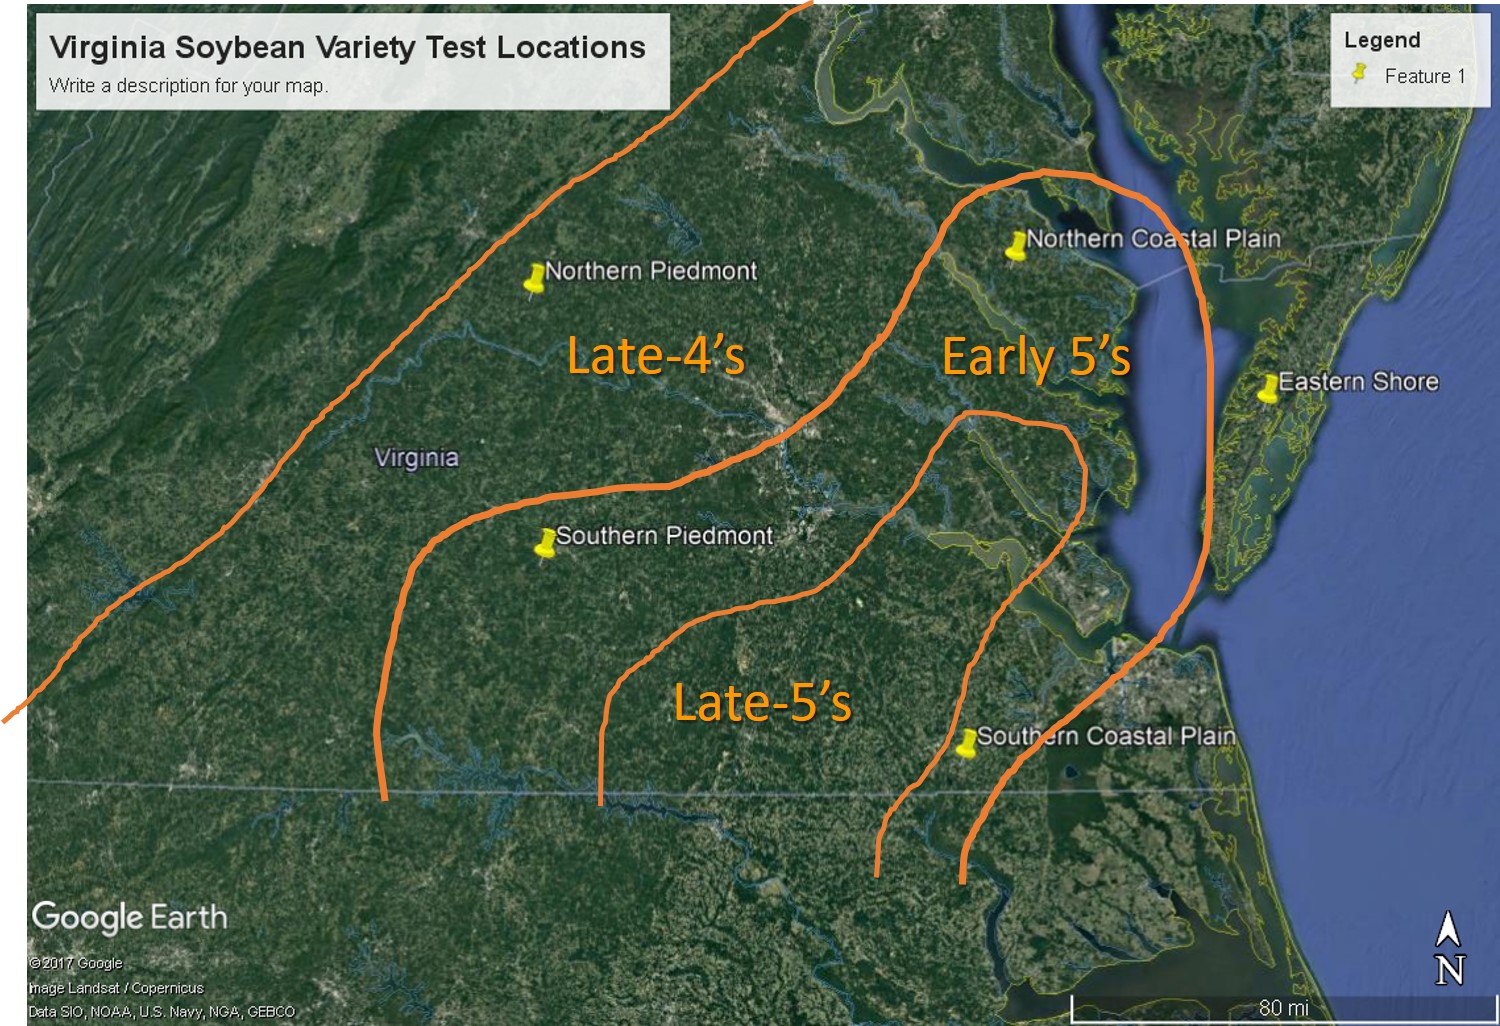
I’ve made an attempt at drawing a Virginia map.  But do not read too much into this!  This is based only on 5 locations (although 10 site-years and thousands of plots at each location) and the “devils in the detail”.  An I did not use GIS to draw this map (the lines are not 100% accurately located).

Do not assume that I want you to plant only these RM in these areas, only that these tend to do best in most years.

How do you use these data?  Make most of your chosen varieties fit these results.  However, allocate a smaller acreage to those RM’s that can occasionally break records.

On a closing note, these data also indicate that early RM’s do better on our best, most productive land.  But, that’s a topic for next week.

Distribution of Herbicide-Resistant Italian Ryegrass in Eastern Virginia

Charlie Cahoon, Extension Weed Specialist

Eastern Shore AREC-Virginia Tech

Italian ryegrass is one of the most common and troublesome weeds Virginia small grain producers face.  The weed competes with wheat for essential nutrients, sunlight, and moisture and also interferes with harvest.  In the past, growers have relied upon herbicides, such as Axial XL, Hoelon, PowerFlex, and Osprey, for control of Italian ryegrass.  However, herbicide resistant Italian ryegrass biotypes have developed, limiting the herbicide options available to growers.

During the summer of 2016, the weed group at the Eastern Shore AREC traveled Eastern Virginia in search of resistant Italian ryegrass.  To broaden the survey, we solicited samples from extension agents and members of the agriculture industry.  In total, 82 samples were collected throughout Eastern Virginia (Image 1).  The objective of this survey (and subsequent resistance screening) was to determine the distribution of resistant biotypes in Virginia; allowing growers to tailor management strategies specific to biotypes in their area.

Italian ryegrass heads collected during the summer were allowed to dry down and then threshed to separate the seed.  Approximately 400 seed from each population were planted in a seed tray.  Once Italian ryegrass reached 3.5 to 4 inches in height (1 to 2 leaf), plants were treated with a 1X rate of Axial XL (16.4 oz/A), Hoelon (43 oz/A), PowerFlex HL (2 oz/A), and Osprey (4.75 oz/A). A non-treated check from each sample location was included for comparison purposes.  Visual injury was recorded at 28 days after treatment (DAT) for Italian ryegrass treated with Axial XL and Hoelon.  PowerFlex HL and Osprey are both ALS-inhibiting herbicides and act much slower than the ACCase-inhibiting herbicides (Axial XL and Hoelon).  Therefore, ryegrass treated with these products were evaluated 42 DAT.  Also at 42 DAT, Italian ryegrass biomass (and subsequent % biomass reduction) was determined by cutting and weighing the above ground portion of ryegrass.
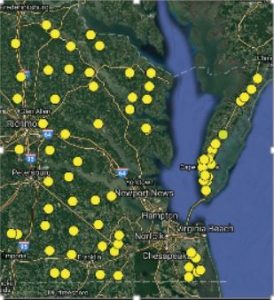
Image 1. Locations of 2016 Italian ryegrass samples collected.

Overall, approximately 23% of all samples collected were resistant to Axial XL (Image 2) compared to 30% that were resistant to Hoelon (data not shown).  Most samples resistant to Hoelon were also resistant to Axial XL.  However, for 6 samples, Axial XL remained effective despite poor Hoelon activity.  Axial-resistant Italian ryegrass is widespread in two of Virginia’s major wheat producing regions (Eastern Shore and southern Chesapeake/Virginia Beach).  Of the 14 samples collected in Northampton Co., 9 were found to be resistant to Axial XL (64%).  In contrast, none of the 5 samples collected from Accomack Co. were Axial-resistant.  In southern Virginia Beach and Chesapeake, 5 of 6 samples collected were resistant to Axial (83% of samples).  Excluding the Eastern Shore and southern Chesapeake/Virginia Beach, only 9% of remaining samples were resistant to Axial XL; 1 samples east of Stony Creek in Sussex Co.; 1 sample south of Waterview in Middlesex Co.; 1 sample northeast of Newtown in King and Queen Co.; 1 sample northwest of Loretto in Essex Co.; and 1 sample south of Somers in Lancaster Co.
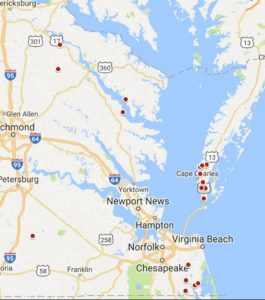
Image 2. Distribution of Axial-resistant Italian ryegrass in Virginia.

ALS-resistant Italian ryegrass is more widespread throughout eastern Virginia.  Of the surveyed populations, 92 and 93% were resistant to Osprey and PowerFlex HL, respectively.  Producers should keep in mind the presence of herbicide-resistant Italian ryegrass nearby does not automatically mean they have a resistant biotype on their farm.  Fields with escaped Italian ryegrass were purposely chosen for this survey.  It is best to rely on field history and performance of herbicides in the past when making management decisions.  However, it is always a good idea to rotate modes of action to delay the development of resistant biotypes.

Unfortunately, if ryegrass is resistant to Axial XL and the ALS-inhibiting herbicides (Osprey and PowerFlex HL), there are no postemergence options left.  In this situation, a residual product that includes pyroxasulfone (Anthem Flex and Zidua) is suggested delayed-preemergence or early postemergence.  These products offer residual control of ryegrass only (they will NOT control emerged ryegrass).  It is imperative that these products are applied and activated by a timely rainfall prior to ryegrass emergence.  Rotating away from wheat also presents an opportunity to control Italian ryegrass (and prevent seed production) with glyphosate early burndown prior to planting corn or full-season soybean.  Be aware that glyphosate-resistant Italian ryegrass is suspected in northeast North Carolina and eastern Virginia.  In this situation, paraquat plus a residual herbicide like s-metolachlor applied to fallow ground during the fall would be in order.
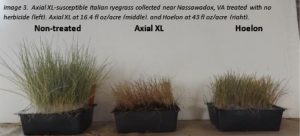
Image 3. Axial XL-susceptible Italian ryegrass collected near Nassawadox, VA treated with no herbicide (left), Axial XL at 16.4 fl oz/acre (middle), and Hoelon at 43 fl oz/acre (right).
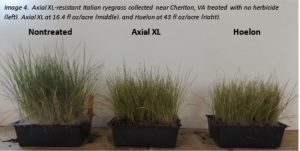
Image 4. Axial XL-resistant Italian ryegrass collected near Cheriton, VA treated with no herbicide (left), Axial XL at 16.4 fl oz/acre (middle), and Hoelon at 43 fl oz/acre (right).



Eastern Shore AREC Field Day CANCELED!

Due to impending rain Tuesday and Wednesday and already saturated soils, the Eastern Shore AREC field day scheduled for Wednesday, September 13, 2017 has been canceled. Let’s hope Hurricane Irma keeps tracking further west. We certainly do not need any more rain!

Eastern Shore AREC Field DAY: September 13th, 2017

Please join us for Virginia Tech’s Eastern Shore Agricultural Research and Extension Center (ESAREC) 2017 Research Field Day on Wednesday, September 13th. Registration is free, open to the public and will begin at 8:00 AM at the ESAREC complex located at 33446 Research Drive, Painter, Virginia 23420. The field tour will begin at 9:00 AM and conclude with lunch at 12:30 PM.  See the attached flyer for specific projects to be highlighted and more information.

If you would like more information or are interested in sponsoring this event, please contact Lauren Seltzer at 757-414-0724 ext. 11 or email at mlpeyton@vt.edu.

2017 ESAREC Field Day Announcement

Plant Bug Update – 4 August 2017

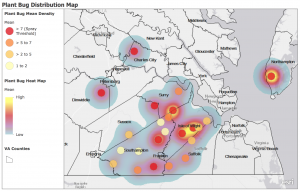
Twenty-three representative cotton fields in eight Virginia counties were scouted weekly for mean plant bug density. Data for the July 17th to August 3rd sampling period is represented in the distribution map below (follow link to view). Red dots on the map represent fields that have averaged at or above the spray threshold for plant bug during the sampling period. Plant bug densities for multiple fields has increased substantially since the last update in mid-July. Nineteen of the 23 sampled fields have reached the spray threshold at least once this season since sampling began in late-June. Plant bugs are present in every county sampled and are likely present in at least low numbers in all cotton growing counties in the state. Therefore, we recommend scouting your cotton fields regularly for plant bug.

The spray threshold for plant bug in Mid-Atlantic cotton is eight plant bugs (i.e., adults and nymphs) per 100 sweeps in addition to square retention below 80 percent. We recommend conducting four to eight random 25-sweep samples throughout each field. Once flowering begins, we recommend continuing sweep net sampling and also looking for dirty blooms (pictured below) or sample dime to quarter size-bolls from 25 random plants for internal feeding damage (e.g., warts, stained lint, punctures). Spray treatment may be warranted if dirty blooms and or internal damage exceeds 15 percent and plant bugs are also active in the field. Please refer to the Virginia Cotton Production Guide (pg. 23)  or Pest Management Guide (sect. 4, pg. 88) for spray recommendations if spray threshold is reached.

“Dirty bloom” indicative of plant bug feeding.

When viewing the distribution map in full-screen mode, click on the left arrow icon to view map legend. Click on individual fields represented by colored dots on the map to view mean plant bug density for the sampling period as well as total mean density for the season. Mean plant bug densities were calculated by sampling four sweet net samples (25 sweeps per sample) and four drop cloth samples across each field. Total adults and nymphs in a single visit were totaled and averaged for each visit within the sampling period.

View full-screen distribution map

Plant bug distribution map for the July 17th to August 3rd sampling period.


Small upsurge in kudzu bug populations

Kudzu bug has been spotted above threshold (1 nymph per sweep – use at least 15 sweep samples in multiple parts of the field) in south central Virginia and in parts of central North Carolina. Kudzu bugs typically move into soybean in July-August in our state. Distribution surveys conducted by the entomology department in 2016 showed that kudzu bug are present in many soybean growing regions of our state.

Please consider the following information before making the decision to spray for this pest.

  1. Wait until nymphs (nymphs are wingless and cannot fly) are present in the field. Adults can make multiple invasions into a field. You do not want to make repeated sprays for this pest.
  2. Insecticides labeled for kudzu bug are broad-spectrum and will kill beneficials in your field. We are experiencing a large and early corn earworm flight this year in Virginia. Worm pests are much more likely to be a problem in fields that have been previously sprayed.

I’ll keep you posted on what we are seeing in soybean throughout Virginia. Please call if you have something to report.

Sally 919-801-5366

What You’ll See in the Field at the Virginia Ag Expo

As another reminder, the Virginia Ag Expo is Thursday, Aug. 3 at Renwood Farms in Charles City.  The event opens at 7:30 am and will run through mid-afternoon.

There is something for all corn and soybean farmers in the field this year.  Go on the field tour and you will be able to chat with Extension Specialists, company reps, and others about the research being conducted or anything else on your mind.

As always, the Ag Expo is home of one of our numerous on-farm corn hybrid and soybean variety tests.  This year, you will view 31 corn hybrids from 11 companies and 47 soybean varieties from 14 companies.  Drs. Mike Flessner and Charlies Cahoon will demonstrate off-site herbicide injury with some of our newest seed/chemical technologies.  Dr. Wade Thomason is evaluating in-furrow and starter fertilizer in corn.  The soil fertility team, led by Dr. Mark Reiter, is investigating fertilizer recommendations to ensure optimum production for high yielding soybeans.  You will view one of Dr. David Holshouser’s seeding rate trials as he is in the process of establishing variable rate seeding recommendations.  You will also see an experiment that you may have viewed at last year’s Ag Expo investigating the interaction of planting date with relative maturities.  Companies are participating in our plots with in-furrow and foliar sprays that offer potential to enhance yield potential under high-yielding conditions.  Finally, you’ll go below ground to view Virginia’s state soil, a Pamunkey loam, and discuss this yield contest-winning properties with NRCS personnel.

This is a walking, go-at-your-own-pace tour designed to fit your interest and schedule.  Buses will be running continuously to take you to and from the plots.  Enjoy!

Plant Bug Distribution Map

Twenty-three representative cotton fields in eight Virginia counties were scouted weekly for plant bug abundance and square retention. Data for the June 28th through July 13th sampling period is represented in the distribution map below (follow link to view). We will continue to post updates to the map through peak plant bug abundance in cotton. Sweep net and drop cloth samples were taken for each field to account for sampling bias associated with sweep net sampling towards adult captures and drop cloth sampling towards nymphal captures. When sampling cotton fields for plant bugs, look carefully for nymphs (pictured below). Since nymphs are flightless, they may spend more time feeding in an isolated area and cause more damage than adults because their movement in and out of fields is limited. The action threshold for plant bug in Mid-Atlantic cotton is generally eight plant bugs (i.e., adults and nymphs) per 100 sweeps in addition to square retention below 80 percent.

Plant bug nymph feeding on weedy host, buckhorn plantain (Plantago lanceolata).

When viewing the distribution map in full-screen mode, click on the left arrow icon to view map legend. Click on sampling labels on the map to view square retention and number of samples taken from each site. Mean plant bug densities were calculated by sampling four sweet net samples (25 sweeps per sample) and four drop cloth samples across each field. Total adults and nymphs in a single visit were totaled and averaged for each visit within the sampling period.

Click here to view full-screen distribution map

Plant bug distribution map in Virginia cotton sampled from 28 June to 13 July 2017.