Twenty-three representative cotton fields in eight Virginia counties were scouted weekly for mean plant bug density. Data for the July 17th to August 3rd sampling period is represented in the distribution map below (follow link to view). Red dots on the map represent fields that have averaged at or above the spray threshold for plant bug during the sampling period. Plant bug densities for multiple fields has increased substantially since the last update in mid-July. Nineteen of the 23 sampled fields have reached the spray threshold at least once this season since sampling began in late-June. Plant bugs are present in every county sampled and are likely present in at least low numbers in all cotton growing counties in the state. Therefore, we recommend scouting your cotton fields regularly for plant bug.
The spray threshold for plant bug in Mid-Atlantic cotton is eight plant bugs (i.e., adults and nymphs) per 100 sweeps in addition to square retention below 80 percent. We recommend conducting four to eight random 25-sweep samples throughout each field. Once flowering begins, we recommend continuing sweep net sampling and also looking for dirty blooms (pictured below) or sample dime to quarter size-bolls from 25 random plants for internal feeding damage (e.g., warts, stained lint, punctures). Spray treatment may be warranted if dirty blooms and or internal damage exceeds 15 percent and plant bugs are also active in the field. Please refer to the Virginia Cotton Production Guide (pg. 23) or Pest Management Guide (sect. 4, pg. 88) for spray recommendations if spray threshold is reached.
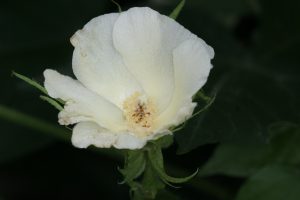
“Dirty bloom” indicative of plant bug feeding.
When viewing the distribution map in full-screen mode, click on the left arrow icon to view map legend. Click on individual fields represented by colored dots on the map to view mean plant bug density for the sampling period as well as total mean density for the season. Mean plant bug densities were calculated by sampling four sweet net samples (25 sweeps per sample) and four drop cloth samples across each field. Total adults and nymphs in a single visit were totaled and averaged for each visit within the sampling period.
View full-screen distribution map
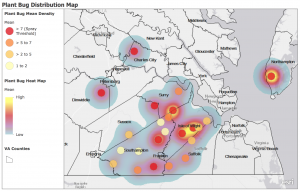
Plant bug distribution map for the July 17th to August 3rd sampling period.

