Peanut iPiPE and Disease Advisories

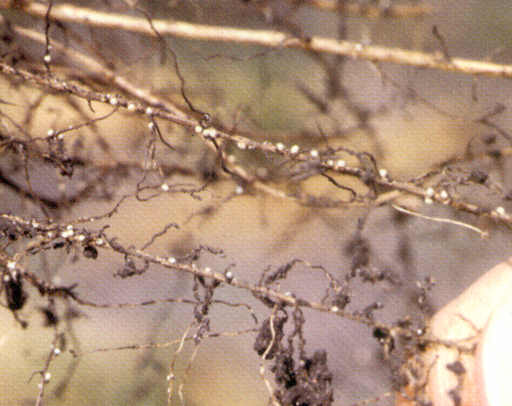
Especially with all the wet weather we have been having in much of the region, it is time to start thinking about peanut diseases. We do not typically see a lot of disease until the canopy closes, but once the vines are touching the environment within the canopy becomes favorable for disease development. Leaf spot programs should be applied beginning at early beginning pod then according to a calendar-based (usually 14 day intervals) or advisory based program. The leaf spot advisory for Virginia can be found at https://webipm.ento.vt.edu/cgi-bin/infonet1.cgi. Some keys to a successful leaf spot fungicide program include:

  1. Make the first application at the appropriate time (not too late).
  2. Apply fungicides regularly before leaf spot outbreaks are observed (once disease is present it is difficult to slow down the epidemic).
  3. Stick to a regular calendar-based program or utilize leaf spot advisories.
  4. Be mindful of fungicide resistance management (rotate chemistries and/or tank mix with chlorothalonil).
  5. Scout for soil-borne diseases and utilize fungicides with activity against both leaf spot and other target diseases (e.g. for both late leaf spot and southern stem rot control use a product such as Provost, Elatus, Priaxor, etc.).

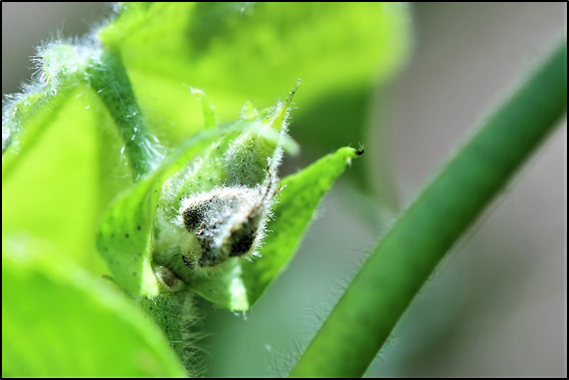
Data are currently being collected to improve both leaf spot and Sclerotinia advisories and to develop a southern stem rot fungicide advisory for peanut. This is being conducted through the Peanut iPiPE program. The Integrated Pest Information Platform for Extension and Education (iPiPE) is a program that allows farmers and extension agents to share information with each other through the internet.  iPiPE works by allowing users to enter pest data such as presence and severity of diseases or insects. This data will be shared with everyone in an effort to create a more precise system of pest monitoring and management. The Plant Pathology program at the Virginia Tech Tidewater AREC is leading the Peanut iPiPE and using it to improve disease advisories based on observations of disease onset in peanut fields throughout the region. Two undergraduate interns are currently scouting for peanut diseases in the region, and they will enter disease observations into the iPiPE database.

Disease and pest observations can be easily uploaded to the database through a mobile phone app or the online platform. We are encouraging anyone who scouts peanuts to help us collect disease observations. To become a participant, you can request an iPiPE account by visiting the iPiPE platform (http://www.ipipe.org/). Detailed information on the iPiPE platform and a user guide for the mobile app can be downloaded below. Alternatively, you can email disease observations to Dr. Hillary Mehl (hlmehl@vt.edu). In addition, if you are located in southeastern Virginia or northeastern North Carolina and are interested in having your peanut crop scouted for diseases by our iPiPE interns, please contact us.

Peanut iPiPE Stakeholder Card 2018

Peanut iPiPE Users Guide 2018

For more information or questions regarding the Peanut iPiPE contact Dr. Hillary Mehl (hlmehl@vt.edu).


Plant bug scouting report – Week 2

A team led by graduate student Seth Dorman scouted 34 VA fields for plant bugs this week. Plant bugs were found in all but 4 fields, 6 fields were over threshold. Prior to bloom, fields require treatment if you find 8 plant bugs in 100 sweeps AND less than 80% square retention.

Nymphs are increasing in number. Young nymphs are small (aphid-sized) and thus, can be harder to scout for. They will be captured in sweep nets – be mindful when checking the bottom of the net. I recommend sampling with a black beat cloth later in the season to help identify nymphs in blooming cotton.

I will continue to provide updates and recommendations as cotton begins to bloom in our area. My thanks to Seth Dorman and team for their continued effort.

Yellow soybean leaves may be due to manganese (Mn) deficiency

Manganese (Mn) deficiencies are common in Virginia soybean and are starting to appear in numerous fields.  These deficiencies are not necessarily due to low Mn levels in the soil, but are more likely related to high soil pH levels, as its availability decreases with increasing soil pH.

Although soils with a pH of 6.2 or lower can occasional show Mn deficiencies, it is most likely to appear when pH levels reach 6.5 or above.  Furthermore, Mn deficiencies are more common on our sandier soils because pH changes more rapidly and these soils typically have a lower concentration of the nutrient.

The deficiency will appear as interveinal chlorosis, usually on the younger leaves first since Mn is not a mobile nutrient.  MnDeficiency0721101059
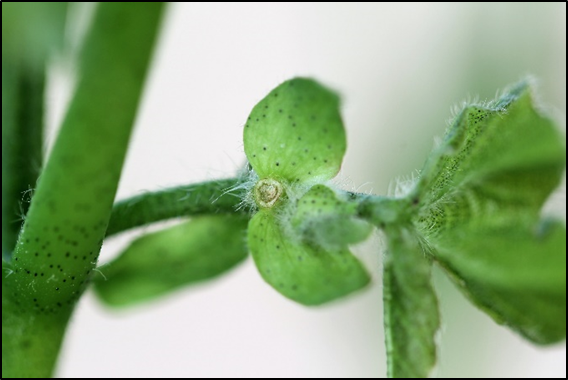
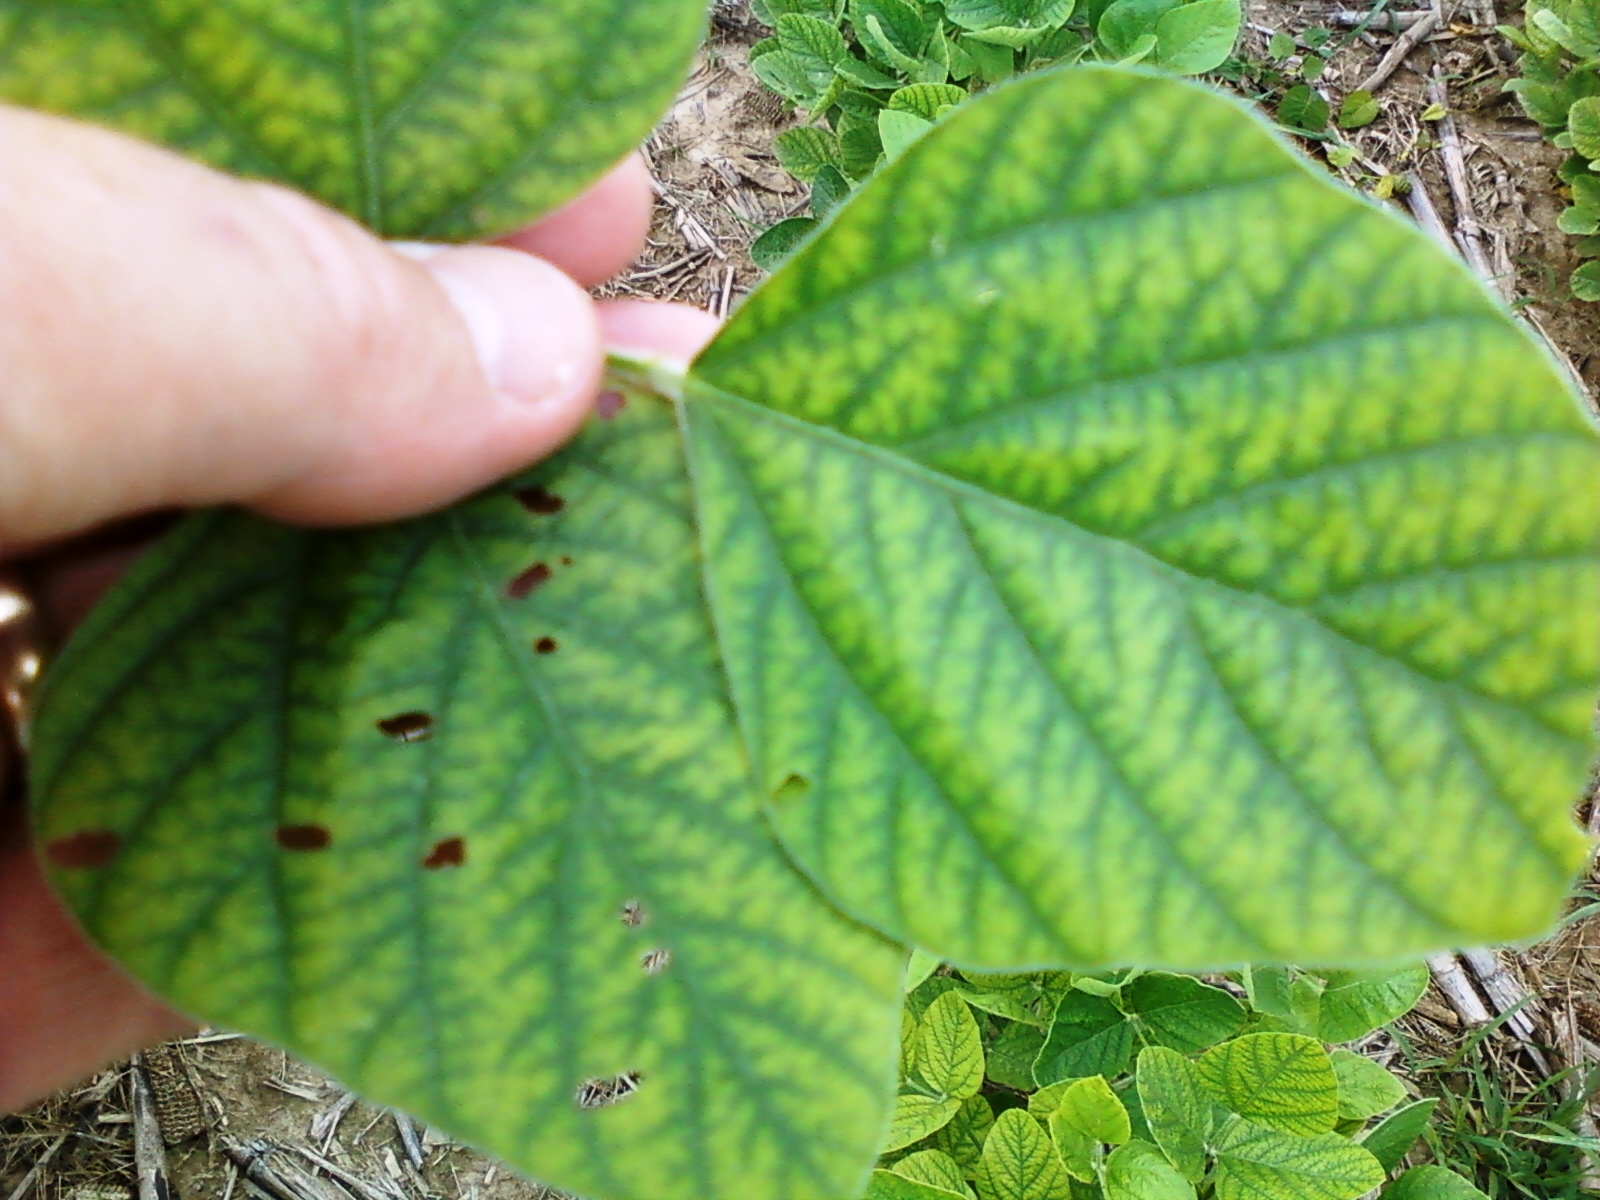
This may distinguish Mn deficiency from magnesium (Mg) deficiency.  Magnesium deficiency symptoms will usually appear on the lower leaves while the upper leaves remain green.  Still, I’ve seen Mn deficiency on the lower to middle leaves.  This usually happens when the field has not been checked in a while and the observer missed the symptoms when they were on the younger leaves.Cyst nematode on roots

Other problems can cause look-alike symptoms similar to Mn deficiencies.  In particular, interveinal yellowing is a common symptom of soybean cyst or other nematode damage.  Therefore, it may be prudent to further investigate the problem, especially the root system.

Use the following guidelines for Mn applications:

Scout your fields.  Mn deficiencies may or may not materialize.  The only sure way to determine a deficiency is to observe the deficiency symptoms through visual observation or tissue tests.  The characteristic visual symptom is yellowing between the veins on the new leaves.  Mn is an immobile nutrient.  Therefore, it will not move out of older leaves to the new leaves.  Symptoms will appear when the plant can no longer extract sufficient amounts of the nutrient from the soil.

Take a tissue sample.  If Mn deficiencies are suspected due to high pH and/or a field history of Mn deficiencies, but no symptoms have yet appeared, you should consider taking a tissue sample.  Tissue samples can reveal deficiencies before symptoms appear (hidden hunger).  We suggest a tissue test if lime, lime stabilized biosolids, or an ash product was recently applied.

Manganese application.  To overcome a deficiency, apply ¾ lb. chelated Mn (elemental basis) or 1 lb. inorganic Mn (elemental basis) per acre to foliage upon appearance of symptoms and prior to flowering.  More than one application may be required to correct a severe deficiency.

Don’t use low rates to correct a deficiency.  Note that many Mn products recommend applying lower rates of Mn.  However, the label usually states that these are maintenance rates.  Once a deficiency occurs, these lower rates will not correct the deficiency and the rates stated above will be needed.

Split Mn application on deficiency-prone soils.  An alternate method of application can be used before a deficiency is evident on soils that commonly show a deficiency, especially on soils that have a high pH (above 6.8 or so).  A lower rate (~ ½ of that listed above) can be combined with another scheduled application, such as a postemergence herbicide or insecticide.  This may be a sufficient rate to prevent a deficiency from occurring.  But, continue to scout the field and take future corrective measures if visual deficiencies appear.  If a visual symptom appears, you need to use the full rate.  I will remind you that this is a preventative treatment.  A deficiency may not occur.  Furthermore, these are only maintenance rates and another application will likely be needed if the field is truly deficient.

Use EDTA chelated Mn formulations when mixing with glyphosate.  Be reminded that some Mn formulations in combination with glyphosate herbicide (Roundup, Touchdown, many generics, etc.) will result in reduced weed control of certain weeds.  Other herbicides have not shown to interact.  If including Mn with glyphosate, use the EDTA chelated formulation as it has shown not to interact.

Don’t spray if you don’t need it.  In addition to the cost, Mn can be toxic to soybean.  Spraying greater than recommended rates or spraying as a preventative spray when soil pH is relatively low (5.7-5.9) could lead to toxicity problems

Start scouting cotton now for tarnished plant bug

Black squares and missing squares are a sign that plant bugs have fed in your field. Scout to determine if they are still active.

Tarnished plant bug (TPB) has begun its annual migration into Virginia cotton. PhD student Seth Dorman scouted VA cotton fields this week (image below) that were over pre-bloom thresholds (indicated in red).

Plant bugs can be found in every VA cotton field from the first square on, but it does not pay to spray unless they are causing damage. Use thresholds when determining what fields to treat and use a sweep net to sample multiple places in a field since populations are not evenly distributed. Prior to bloom, fields require treatment if you find 8 plant bugs in 100 sweeps AND less than 80% square retention. Adults are highly mobile and can reinfest quickly following applications. It may be tempting to spray only later in the season. If you are above threshold, this decision will lower your yield.

Impact of different spray timings on yield. Spraying at any point in the season yielded higher than unsprayed cotton. Thresholds are as effective as weekly sprays and will save you money. The damage potential in late-plated cotton is higher.

Important considerations for this season include:

1) Late-planted cotton is at higher risk. This picture from last season shows that losses in late-planted cotton (Jun 1) are much greater than in early-planted cotton (May 1).

Effects of different spray timings on lint yield are much more apparent in late-planted cotton. Spraying for plant bugs at threshold will save money and increase yield regardless of planting date.

2) Spraying at threshold is as effective as weekly sprays and costs less money. Spraying only early (pre-bloom) or only late (>5th week of bloom) are the least effective spray timings.

3) Rotate insectides. Some populations in the Suffolk area are surviving high doses of acephate and bifenthrin. If your cotton is squaring, thrips treatments are no longer needed and acephate should be left out of the tank. I recommend using a neonicotinoid product pre-bloom (clothianidin, thiamethoxam, or imidacloprid). Check the label and use the highest allowable rate. Neonicotinoids will not provide adequate control after cotton has bloomed.

Seth’s team will continue to scout VA cotton counties and we will post distribution updates and management recommendations as the season progresses. I would like to thank Seth for his hard work on this problem. If you have concerns, please contact me.

Wet Soils, Poor Stands – Do I Replant?

The decision of whether or not to replant arises every year; however, the wet soil conditions seem to have worsened the problem this year.  There of course will be areas that the decision is easy – flooded areas resulting in almost no stand.  But, what about fields that just are not living up to your expectations?  I’ve seen and heard many reports of stands being reduced 25 to 50% of what was expected (keep in mind that our expectations are sometimes too high).

First, I must mention that final average stands of 60,000 to 80,000 plants/acre rarely profit from replanting.  Only when you get below 50,000 can it be economically justified.  I refer you to the seeding rate data shown.  Note that yield does not fall off until seeding rates fall below 90 to 120 thousand seed/acre (76 to 107 seed/acre on productive soils).  Stands generally averaged 75%; so, this is equal to  65 to 90 thousand plants/acre.  Once you add in the cost and of and time required to replant, it’s not usually worth it – unless the stand less than this.


Steps to Estimate the Profitability of Replanting Soybean

Determining whether or not to replant is hard.  To ease the pain, I’ve summarized some relatively simple steps to help in your decision.  One should incorporate 2- to 3-foot gaps into your decision to improve the estimation of yield loss.

  1. Determine the cause of the poor stand.  Was the poor stand the result of poor seed quality, cold wet soils, hot dry soils, planting too deep or shallow, soil crusting, herbicide injury, insect or slug feeding, poor soil to seed contact, or disease infection?  Determine if the cause can be corrected to avoid a similar situation.  If slug or insect feeding or disease is the cause, then you might expect poor stands again.
  2. Estimate the stand and percent stand loss due to gaps.  Pace off the sections of row 20 paces long in at least 6 areas of the field.  Determine (in number of paces) the total length of row lost to 2- to 3-foot gaps.  For drilled soybean, this can be interpreted at 2- to 3-foot diameter gaps.  Then determine the percent of row lost to gaps.  In addition, count and determine average number of plants per foot in sections of row not reduced by gaps.  The simplest method is to count the number of healthy plants (capable of recovery) in a length of row equaling 1/1000 of an acre.  For instance:
  • 36-inch rows = 14.5 feet
  • 30-inch rows = 17.5 feet
  • 20-inch rows = 26 feet
  • 15-inch rows = 35 feet
  • 7.5-inch rows = 70 feet

Then, just multiply your counts by 1,000 to get plants per acre.

Or, use the Tables 1 or 2 to determine remaining plant population.  The “hula hoop” method (Table 2) is valuable with drilled soybean or when rows cannot be distinguished.  This involves placing a circular measuring device such as a hula-hoop on the ground and counting the plants contained within.

Table 1. Plant populations of different row spacing with different plant counts per foot.
Plants/ foot Row Spacing
36 30 24 20 15 7.5
Plant Population (1,000’s/acre)
1 15 17 22 26 35 70
2 29 35 44 52 70 140
3 44 52 65 78 105 210
4 58 70 87 105 139 278
5 73 87 109 131 174
6 87 105 131 157 209
7 102 122 152 183 244
Table 2. Hula-hoop method for determining drilled soybean populations.
No. ofPlants Inside Diameter of Hula Hoop
30” 32” 34” 36” 38”
Plant Population (1,000’s/acre)a
6 53 47 41 37 33
10 89 78 69 62 55
14 124 109 97 86 77
18 160 140 124 111 100
22 196 172 152 136 122
26 231 203 179 160 144
aPlants/acre = no. plants ¸ (3.14 x r2 ¸ 43,560 ft2) where r = radius of hula hoop in feet.
  1. Estimate the yield of the poor stand.  Use Tables 3 and 4 to determine percent of yield potential for full-season and double-crop plantings, respectively.  Note that Table 3 is data from Illinois from the 1980’s. In my opinion, the remaining plant population numbers are too high.  Although I have not conducted full-season plant population studies that have included gaps, I suggest that you change those numbers to  60, 90, and 120 (based on Virginia data).  Multiply this percentage by the expected yield. This is the yield to expect from the deficient stand.
    Table 3. Yield response (% of maximum) of full-season soybeans to deficit standsa.
    % Stand lost to gapsb Remaining Plant Pop (1,000’s/A)
    70 105 140
    0 95 97 100
    10 93 96 98
    20 91 93 96
    30 88 90 93
    40 83 86 89
    50 78 81 84
    60 73 75 78
    aSource: Pepper and Wilmot.  Managing Deficit Stands. 1991. Illinois Cooperative Extension Cir. 1317.bGaps of 12 inches or more; 30-inch rows

    Note that these data are from Virginia.

    Table 13.4.  Yield response (% of maximum) of double-crop soybeans to deficit standsa.
    % Standlost to gapsb Remaining Plant Pop (1,000’s/A)
    100 140 180 220
    0 80 88 95 100
    20 71 79 86 91
    40 61 69 76 81
    60 48 57 64 69
    aSource: 2001-2004 experiments, Suffolk, VA.bGaps of 3 feet; 15-inch rows; MG 4 variety
  2. Estimate the yield from replanting.  After mid-June, decrease the expected yields an additional half of a bushel per acre per day delay in planting.  This is the yield to expect from delayed planting.
  3. Determine the gain or loss from replanting.  Subtract the expected yield of the poor stand (step 3) from the yield expected from delayed planting.  This is the gain or loss in bu/A from replanting.  Multiply this number by the expected price ($/bu), using future prices, to obtain gain or loss in $/A.
  4. Estimate the cost of replanting.  Include per acre cost of tillage, herbicide, fuel, seed, and labor.
  5. Determine profitability of replanting.  Subtract your cost of replanting from your estimated gain from replanting.


Flooded Soybeans – How Much Damage? What to do?

Rainfall across the state resulted in in saturated soils and sometimes flooded soybeans or fields to be planted in soybean.  Although fields are drying out, more rain is expected this weekend.

It’s difficult to know the long-term effect of flooding on soybean fields. Research is limited, but we do know that the fate of flooded fields will largely depend on 1) the development stage during which the flood took place; 2) the duration of the flood; 3) the temperature during and right after the flood; and 4) the drying rate after the flood.

Basically a flooded field depletes the roots of oxygen (O2), causing photosynthesis to slow.  After several days without O2, the plant may turn yellow, grown very slowly, and possibly die.  Other indirect effects of flooding can include reduced nitrogen-fixing bacteria (but they will recover), nutrient imbalances, and increased disease pressure.

For more detailed information, see a blog post that I wrote  in 2013 at the Virginia Soybean Update site.

In short, here are a few pointers for flooded fields.  If soybean have not yet been planted:

  1.   I don’t recommend tillage to dry the soil out for continuous no-till fields.  Tillage will destroy the soil structure that you’ve built since tillage was stopped.  The field is probably draining better than it ever was; tillage will just cause water to stand longer in the future.
  2. Bradyrhizobia japonicum, the nitrogen-fixing bacteria that helps provide soybean with that nutrient, is harmed by lack of oxygen caused by the flood.  Although the bacteria will recover, it may be prudent to add inoculant to the seed in areas that were flooded.

For flooded fields that have been planted:

    1.  Minimize any addition stress by staying out of the field.  Do not try to plant or replant too soon.  More damage can be done to the soil and more yield can be lost from planting into we soils than from planting too late.
    2. If soybean have not yet emerged and crusting evident, light tillage with a rotary hoe will help emergence.
    3. Evaluate the stand. If a stand reduction occurred, determine if it’s worthwhile to replant. Remember that after mid-June, every day delay in planting will cost you about ½ of a bushel in yield. The plants that remain are still higher yielding than seed that can now be planted, even if the stand has been substantially reduced.
    4. Stress such as herbicide injury can slow the crop down further. Still, weeds need controlling. But you may want to select herbicides (usually as tank-mix partners to glyphosate) that don’t cause a significant amount of burning.
    5. Finally, some will want to apply some type of foliar fertilizer to the crop to “kick-start” it back to health.  I see little advantage of this.  Remember that the real problem is lack of O2 to the roots and CO2 buildup in the soil; only after the roots begin to receive O2 will the recovery process start.Hopefully you haven’t experienced severe flooding (> 24 hours).  But if so, be patient and evaluate the field.  Then make good decisions on how to handle it.