Author Archives: David Holshouser

About David Holshouser

David serves as Associate Professor & Extension Agronomist at Virginia Tech’s Tidewater Agricultural Research and Extension Center. He provides leadership for agronomic extension and research programs that lead to profitable and environmentally-responsible agriculture.

Manganese Deficiencies

Mark Reiter, Extension Soils Specialist, and David Holshouser, Extension Agronomist

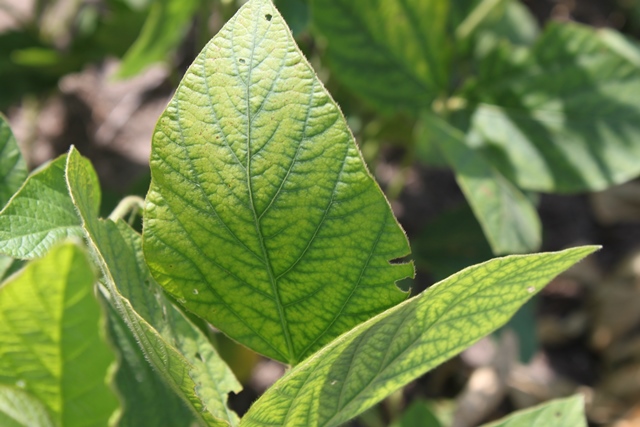
Manganese (Mn) deficiencies are common in Virginia soybean, but these 2010 07 20 Mn Deficiency 002webdeficiencies are not necessarily due to low Mn levels in the soil.  Instead, like many micronutrients (nutrients that are needed by the plant in small amounts), Mn availability to the soybean crop is directly related to soil pH.

When pH levels reach 6.5 or above, Mn deficiencies will likely appear, especially on sandy soils.  However, some soils with a pH of 6.2 and lower can show deficiencies if soil Mn is low.  Generally, Mn deficiencies are more common on our sandier soils as pH changes more rapidly and sandy soils typically have a lower Mn concentration.

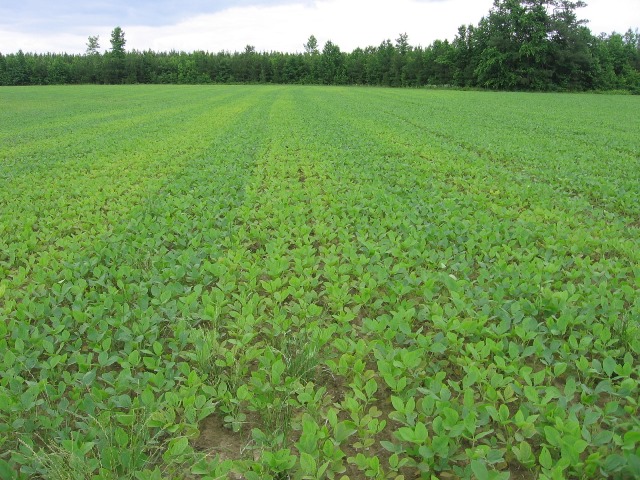
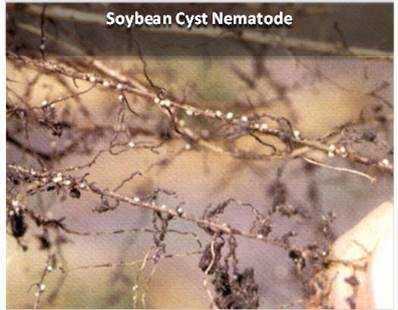
Manganese deficiencies will also reveal themselves with dry soil conditions, especially on tilled soils.  This is because Mn becomes less available under oxidizing conditions.  Oxidizing conditions occur under dry environments where there is more oxygen and less water available in the soil pores.  In this situation, Mn oxides form (basically a rock) and Mn oxides are not available for plant uptake.  In places with more soil compaction, such as wheel tracks, or under wetter conditions (more pore space is occupied by water), Mn oxides will be reduced to Mn2+, the form of plant uptake.  This is why we often see Mn deficiencies throughout a field but not in wheel tracks where the soil is more firm.  Firmer soils don’t have as much pore space; therefore, they have less oxygen to form Mn oxides.  Shown below is an example of this.Mn Def - Sussex 2007 3webFinally note that other problems can cause look-alike symptoms similar to Mn deficiencies.  In particular, inter-veinal yellowing is a common symptom of soybean cyst or other nematode damage.  Therefore, it may be prudent to further investigate the problem, especially the root system.SCN on Roots

Use the following guidelines for Mn applications:

Scout your fields.  Mn deficiencies may or may not materialize.  The only sure way to determine a deficiency is to observe the deficiency symptoms through visual observation or tissue tests.  The characteristic visual symptom is yellowing between the veins on the new leaves.  Mn is an immobile nutrient.  Therefore, it will not move out of older leaves to the new leaves.  Symptoms will appear when the plant can no longer extract sufficient amounts of the nutrient from the soil.

Take a tissue sample.  If Mn deficiencies are suspected due to high pH and/or a field history of Mn deficiencies, but no symptoms have yet appeared, you should consider taking a tissue sample.  Tissue samples can reveal deficiencies before symptoms appear (hidden hunger).  We suggest a tissue test if lime, lime stabilized biosolids, or an ash product was recently applied.

Manganese application.  To overcome a deficiency, apply ¾ lb. chelated Mn (elemental basis) or 1 lb. inorganic Mn (elemental basis) per acre to foliage upon appearance of symptoms and prior to flowering.  More than one application may be required to correct a severe deficiency.

Don’t use low rates to correct a deficiency.  Note that many Mn products recommend applying lower rates of Mn.  However, the label usually states that these are maintenance rates.  Once a deficiency occurs, these lower rates will not correct the deficiency and the rates stated above will be needed.

Split Mn application on deficiency-prone soils.  An alternate method of application can be used before a deficiency is evident on soils that commonly show a deficiency, especially on soils that have a high pH (above 6.8 or so).  A lower rate (~ ½ of that listed above) can be combined with another scheduled application, such as a postemergence herbicide or insecticide.  This may be a sufficient rate to prevent a deficiency from occurring.  But, continue to scout the field and take future corrective measures if visual deficiencies appear.  If a visual symptom appears, you need to use the full rate.  I will remind you that this is a preventative treatment.  A deficiency may not occur.  Furthermore, these are only maintenance rates and another application will likely be needed if the field is truly deficient.

Use EDTA chelated Mn formulations when mixing with glyphosate.  Be reminded that some Mn formulations in combination with glyphosate herbicide (Roundup, Touchdown, many generics, etc.) will result in reduced weed control of certain weeds.  Other herbicides have not shown to interact.  If including Mn with glyphosate, use the EDTA chelated formulation as it has shown not to interact.

Don’t spray if you don’t need it.  Mn can be toxic to soybean.  Spraying greater than recommended rates or spraying as a preventative spray when soil pH is relatively low (5.7-5.9) could lead to toxicity problems

Soybean Replant Decisions

Deciding whether or not to replant can be a gut-retching decision.  I readily admit that the choice to leave the present stand or replant is not a simple one.  With the ever-increasing cost of Roundup-Ready soybeans and diesel fuel, the profitability of replanting may not seem a good idea.  On the other hand, high prices make replanting more appealing.  In the end, your decision should be one based on the estimated dollar gain from replanting.  This will require a careful evaluation of the soybean stand and an analysis of yield potential of the present and replanted crop.   

In general, there is less benefit of replanting if stands are reduced uniformly across the field.  Usually replanting can only be justified where stands have been reduced by half.  However, poor stands usually include gaps in addition to merely a lower plant population.  These gaps must be accounted for.  In addition, one may have a 75-80% stand in parts of the field, while other parts of the field may only have 20-25% of the intended plant population; the decision may be to only replant part of the field. 

Remember to take into account the yield loss from delayed planting.  Up until mid-June, there is very little yield loss from delayed planting.  After this, for every day delay in planting yield declines about half a bushel per day.  For instance, if replanting in late-June/early-July (about 2 weeks late), your potential yield will have declined by 7 bushels per acre.

A few more questions must be asked before we can proceed with a step-by-step procedure for estimating the profit of replanting.  When considering a replant, do you leave plants in the field and plant through them?  In many cases, planting through the poor stand is a possibility.  If you’re using rows wide enough to fit a tractor tire comfortably between them, then you can split the rows and plant enough new plants to get the final plant population up to 100 to 120 thousand plants for full-season systems (if re-planting before mid-June) or 180 to 200 thousand plants per acre for double-cropped systems (this may require equipment or tractor tire modifications).

On the other hand, a drill will cut up many healthy plants and make them less productive than the ones that you just replanted.  Also, if the drill has wide gauge wheels, then you can severely damage a significant number of plants (there’s a significant amount of down pressure on those wheels – enough to crush a plant on hard soil).  And a damaged plant can sometimes act more like a weed than a crop.  Recognize that the plants growing in the field are going to be higher yielding that any that emerges after replanting.  If you destroy or injure those plants, you’ve just writing off some profit.  Therefore, I do not suggest planting through the old stand with a drill.

Another issue is that if you decide to replant, do you switch to an earlier maturity group?  There is little need to plant an earlier-maturing variety.  Here are two general rules of thumbs: 

April/May Plantings:  A 3-day delay in planting will result in a 1-day delay in planting.  Therefore, if planting 30 days later, the crop will mature 10 days later.

June/July Plantings:  A 5-day delay in planting will result in a 1-day delay in maturity.  Therefore, if planting 15 days later, the crop will mature only about 3 days later.

 Most important is to plant a maturity group that would grow as long as possible (therefore producing an adequate canopy for maximum yield) and still mature before the average frost date.  If you’re destroying the old crop and starting over, just make sure that the variety you chose will mature before a frost.  Alternatively, if you are planting into the old crop, you may want to choose a variety about one-third to half a maturity group earlier (depending on planting date differences) so that harvest maturity of both plantings will be more in sync.  For example, if you planted a relative maturity group 5.6 on June 10, then you could choose a relative maturity of 5.2 to 5.4 if replanting on June 25. 

Finally, realize that you’ll need a higher plant population when planting late.  Final stand with a double-crop planting should be at least 180 thousand plants per acre.  If replanting in July, increase the seeding rate to insure at least 220 thousand plants per acre.

  To estimate the profitability of replanting, follow the guidelines listed below.  Be sure to incorporate plant population and gaps in your calculations.  We’ve found that 2- to 3-foot gaps cause as much or more yield loss that from low plant populations.

1.    Determine the cause of the poor stand.  Was the poor stand the result of poor seed quality, cold wet soils, hot dry soils, planting too deep or shallow, soil crusting, herbicide injury, insect or slug feeding, poor soil to seed contact, or disease infection?  Determine if the cause can be corrected to avoid a similar situation.  If slug or insect feeding or disease is the cause, then you might expect poor stands again.

2.    Estimate the stand and percent stand loss due to gaps.  Pace off the sections of row 20 paces long in at least 6 areas of the field.  Determine (in number of paces) the total length of row lost to 2- to 3-foot gaps.  For drilled soybean, this can be interpreted at 2- to 3-foot diameter gaps.  Then determine the percent of row lost to gaps.  In addition, count and determine average number of plants per foot in sections of row not reduced by gaps.  The simplest method is to count the number of healthy plants (capable of recovery) in a length of row equaling 1/1000 of an acre.  For instance:

·      36-inch rows = 14.5 feet

·     30-inch rows = 17.5 feet

·     20-inch rows = 26 feet

·     15-inch rows = 35 feet

·     7.5-inch rows = 70 feet

Then, just multiply your counts by 1,000 to get plants per acre. 

Or, use the Tables 13.1 or 13.2 to determine remaining plant population.  The “hula hoop” method (Table 13.2) is valuable with drilled soybean or when rows cannot be distinguished.  This involves placing a circular measuring device such as a hula-hoop on the ground and counting the plants contained within.

Table 13.1. Plant populations of different row spacing with different plant counts per foot.

Plants/ foot

Row Spacing

36

30

24

20

15

7.5


Plant Population (1,000’s/acre)

1

15

17

22

26

35

70

2

29

35

44

52

70

140

3

44

52

65

78

105

210

4

58

70

87

105

139

278

5

73

87

109

131

174

6

87

105

131

157

209

7

102

122

152

183

244


Table 13.2. Hula-hoop method for determining drilled soybean populations.

No. of

Plants

Inside Diameter of Hula Hoop

30”

32”

34”

36”

38”


Plant Population (1,000’s/acre)a

6

53

47

41

37

33

10

89

78

69

62

55

14

124

109

97

86

77

18

160

140

124

111

100

22

196

172

152

136

122

26

231

203

179

160

144

aPlants/acre = no. plants ¸ (3.14 x r2 ¸ 43,560 ft2) where r = radius of hula hoop in feet.


3.    Estimate the yield of the poor stand.  Use Tables 13.3 and 13.4 to determine percent of yield potential for full-season and double-crop plantings, respectively.  Multiply this percentage by the expected yield. This is the yield to expect from the deficient stand. 

4.    Estimate the yield from replanting.  After mid-June, decrease the expected yields an additional half of a bushel per acre per day delay in planting.  This is the yield to expect from delayed planting.

5.    Determine the gain or loss from replanting.  Subtract the expected yield of the poor stand (step 3) from the yield expected from delayed planting.  This is the gain or loss in bu/A from replanting.  Multiply this number by the expected price ($/bu), using future prices, to obtain gain or loss in $/A.

6.    Estimate the cost of replanting.  Include per acre cost of tillage, herbicide, fuel, seed, and labor.

7.    Determine profitability of replanting.  Subtract your cost of replanting from your estimated gain from replanting.


Table 13.3. Yield response (% of maximum) of full-season soybeans to deficit standsa.

% Stand lost to gapsb

Remaining Plant Pop (1,000’s/A)

70

105

140

0

95

97

100

10

93

96

98

20

91

93

96

30

88

90

93

40

83

86

89

50

78

81

84

60

73

75

78

aSource: Pepper and Wilmot.  Managing Deficit Stands. 1991. Illinois Cooperative Extension Cir. 1317.

bGaps of 12 inches or more; 30-inch rows


Table 13.4.  Yield response (% of maximum) of double-crop soybeans to deficit standsa.

% Stand

lost to gapsb

Remaining Plant Pop (1,000’s/A)

100

140

180

220

0

80

88

95

100

20

71

79

86

91

40

61

69

76

81

60

48

57

64

69

aSource: 2001-2004 experiments, Suffolk, VA.

bGaps of 3 feet; 15-inch rows; MG 4 variety

It’s Time to Increase Soybean Seeding Rates

Wheat harvest has begun.  Remember that soybean yield potential declines with delayed planting date.  During the first two weeks of June, this decline is barely noticeable.  After mid-June, expect yield to decline about ½ bushel per acre per day.  So to minimize soybean yield loss due to late planting, immediately (or as soon as you can) plant.  I like to see the combine and the planter or drill in the field at the same time.

Soybean planted after mid-June will not always develop enough leaf area to capture 90-95% of the available sunlight by early pod development (R3).  Only if four layers of leaves are formed by that time will yield not be affected.  Of course the growing season makes a difference.  Last year in many parts of Virginia, even the latest-planted soybean were able to produce enough leaf area.  But, on average, June- or July-planted soybean are unable to do so.  Therefore it’s important to take actions to minimize this decline.

First, plant as soon as possible.  With the recent rains, soil moisture should not be a problem.  Even if the soil is dry on top, I suggest to go ahead and plant.  You may have to plant a little deeper to hit moisture (don’t plant much deeper than 1.5 inches), but planting depth is not as big of an issue with double-cropped as with full-season soybean.

Second, narrow your row spacing.  Narrow rows will produce more leaf area and canopy over faster.

Finally, increase your seeding rates gradually as time goes on.  I’m suggesting the following plant populations for Virginia in 2013:

  • June 2-8 – 120,000 plants/acre
  • June 9-15 – 140,000 plants/acre
  • June 16-21 – 160,000 plants/acre
  • June 23-29 – 180,000 plants/acre
  • June 30-July 5 – 200,000 plants/acre
  • After July 5 – 220,000 plants/acre

See the seeding rate chart below to determine the seeds per foot of row needed to obtain a certain number of plants per acre.  Note that these seeding rates assume 80% emergence.  For different emergence assumptions, divide your desired plant population by the percent emergence that you expect.


Desired Plant Population

Row Width

Early-June Planting Date

Late-June/Early July Planting Date

120,000

140,000

160,000

180.000

200,000

220,000


(Seed per foot of row assuming 80% emergence)

20

5.7

6.7

7.7

8.6

9.6

10.5

18

5.2

6.0

6.9

7.7

8.6

9.5

15

4.3

5.0

5.7

6.5

7.2

7.9

10

2.9

3.3

3.8

4.3

4.8

5.3

7.5

2.2

2.5

2.9

3.2

3.6

3.9

As planting is delayed, increase seeding rate.

Use lower seeding rates on more productive soils.

Calculation: Desired Plant Pop. ÷ (43,560 sq. ft./acre ÷ row width in ft.) ÷ % emergence

Example: = 180,000 ÷ (43,560 ÷ (15 ÷ 12)) ÷ 0.80 = 6.5 seed per foot of row

In addition to planting date, I’ve found that more productive soils will tolerate lower seeding rates, and less productive soils need higher seeding rates; a more productive soil will produce more leaf area than a less productive soil over the same time period.

After the Flood: How much damage? What to Do?

Although we are currently drying out after the heavy rains over the weekend, I thought it would be a good idea to review the effects of flooding on soybean.  Usually, widespread flooding is not a major issue for us due to the sandy nature of our soils and/or well-drained fields.  Still, it can and has happened.

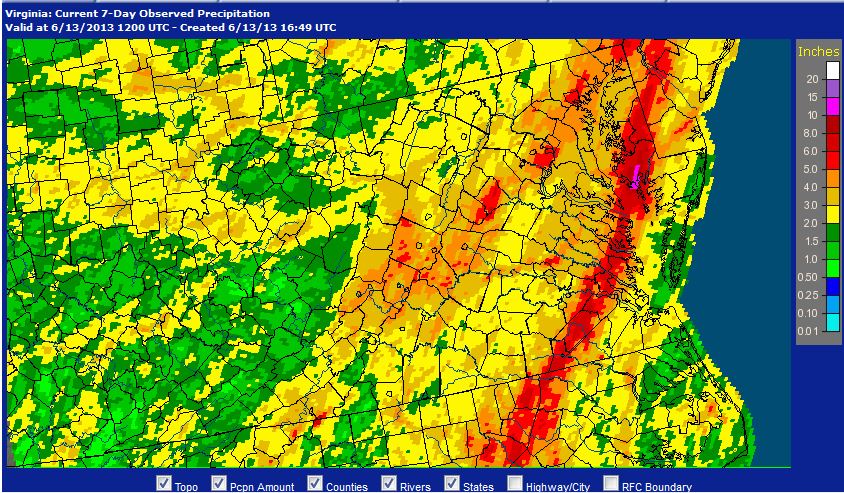
During the week ending on June 12, some parts of Virginia received 6 to 10 inches of rainfall (see map below).  Plus, more may be on the way. Rainfall 061213
This heavy rainfall has resulted in saturated soils and in some cases, flooding.  This field is a Soybean Research Verification Field in Dinwiddie County that I’ve been scouting.  The photo was taken after a hard rain on Friday, June 7.Flooding Soybean Dinwiddie 2013
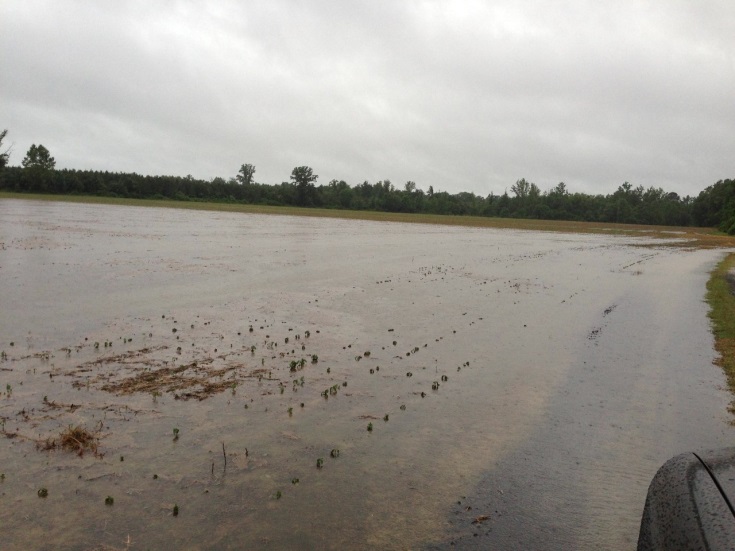
It’s difficult to know the long-term effect of flooding on soybean fields.  Research is limited, but we do know that the fate of flooded fields will largely depend on 1) the development stage during which the flood took place; 2) the duration of the flood; 3) the temperature during and right after the flood; and 4) the drying rate after the flood.

Basically a flooded field depletes the roots of oxygen (O2), causing photosynthesis to slow.  After several days without O2, the plant may turn yellow, grown very slowly, and possibly die.  Other indirect effects of flooding can include reduced nitrogen-fixing bacteria (but they will recover), nutrient imbalances, and increased disease pressure.

Effects on Germination & Emergence.  The most damaging effects of flooding on un-emerged soybean occur when the duration of the flood is greater than 24 hours and/or when the soil temperature is low.  In controlled research conducted during the late 1990’s, researchers examined the effect of flood duration, soil temperature, and time after seed imbibition that the flood occurred.  They found that saturated conditions decreased germination by 15 to 43 percentage points when averaged over temperatures of 59O or 77O F (germination was 62% in the non-flooded control, averaged over temperature treatments).  When flooding lasted only 1 to 12 hours, germination was only decreased by an average of 15 percentage points, regardless of when the seed began imbibing water.  Even after 48 hours of saturated conditions, germination was only reduced by 20 percentage points if the flooding occurred one day after the seed imbibed water.  But, if the flooding occurred 2 or 3 days after the seed imbibed water, then the germination was lowered 33 or 43 percentage points, respectively.  Therefore, the farther along the seed was in the germination process, the more susceptible they were to flood damage.  Lower temperatures during the germination process increased the damage.  At 59OF, germination was lowered by 21 to 25 percentage points, regardless of the duration of the flood.  But at 77OF, germination was only lowered by this amount if the flood lasted 48 hours.  The researchers suggested that damage to the seed under brief flooding was primarily physical (e.g., seed membrane damage), but damage with longer flood duration was physiological (e.g., ethanol toxicity, O2 deprivation, CO­2 build up).

Flooding can also result in soil crusting.  This will be worse in tilled fields that are low in organic matter and surface residue.  Unless the crust is broken with a rotary hoe or similar implement, the emerging seedling, already stressed by the flood, will have an even more difficult time emerging and growing.

There is also an increased chance of seedling disease, but this is less of a problem at this time of the year with warm soil temperatures.  Poor stands will be the biggest issue.  To determine whether or not re-planting will be beneficial, refer to Virginia Soybean Update Vol. 13, No. 3 (June 2012).

Flooding After Emergence.  Soybean can generally tolerate up to 2 days of flooding.  But if the saturated soil conditions persist for more than 2 days, significant yield reductions may occur.  The amount of yield reduction will vary with development stage, duration of the flood, the type of flood (stream overflow vs. low land depressional), temperature during the flood, the drying rate after the flood, and the overall environmental conditions after the flood.

In general, the following comments can be made.  Flooding in the reproductive stages causes more damage than in the vegetative stages.  Yield is reduced more with longer flooding duration and with a slower drying rate of the field (e.g., a well-drained sandy soil will recover faster than a poorly-drained or heavier textured soil).  Higher temperatures after the flood will lead to greater yield losses.  This is because the recovering plant will deplete its stored energy at a faster rate.  In addition, high soil temperatures will result in greater microbial respiration, which lead to greater depletion of oxygen.  The best conditions for a recovering soybean crop are cool, cloudy days and cool, clear nights.

In a Arkansas study conducted on two poorly drained soils with slow permeability (Sharkey clay and Crowley silt loam), researchers found that yield decreased by 1.8 and 2.3 bushels per acre per day of flooding on the Sharkey clay when soybean were flooded from 2 to 14 days at the V4 stage (4 trifoliate leaves on the main stem) and R2 (full flower) stages, respectively.  On the Crowley silt loam soil, yield was reduced 0.8 and 1.5 bushels per day of flooding at V4 and R2, respectively.  It’s worth noting that this research did not have an un-flooded control treatment; therefore, the 2-day period of flooding was considered the control.  This research clearly showed that duration of the flood greatly impacts yield.  In addition, flooding during reproductive stages caused more yield loss that if the flooding occurred at vegetative stage.  Eight varieties were tested, but variety did not affect the flooding response.  Other researchers have however indicated that certain varieties exhibit greater flooding tolerance.

Another study in Louisiana evaluated 7 days of waterlogging on V2, V3, V7, R1, R3, R5, R6, and R6.3 stage soybean under greenhouse conditions. The V stages represent the number of trifoliate leaves on the main stem and the R stages represent beginning flower, beginning pod, beginning seed, full seed, and the temporal midpoint of seed filing.  In summary, the early vegetative stage (V2) and the early reproductive stages (R1, R3, and R5) were most sensitive to waterlogging.Saturated soybean
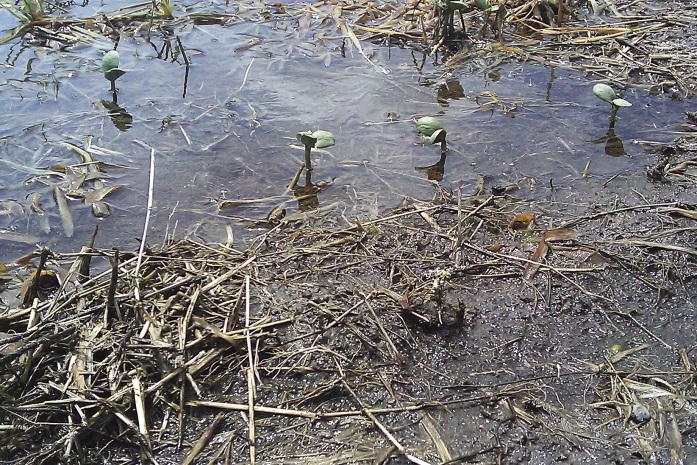
 

Although some research has been conducted, estimating the yield loss due to flooding is nearly impossible because we don’t know what the conditions will be like afterwards.  The best gauge may be ones past experience with fields that have flooded.

Fortunately, some of these experiences have been documented.  An example is research conducted in Ohio in 1998, where researchers monitored several fields that flooded during that year.  They reported a 20% reduction in soybean yield in one field and a complete loss in another field that was flooded for 3 days during the V2-V3 stage.  The field with the complete loss was due to thick sediment coating the plants and not allowing any recovery.  However, flooding for 3 days in two other fields caused no yield loss and flooding actually increased yield in a fifth field.  In the field where yield was increased, sediments covered the plants but a light rain soon after the flooding washed the sediment off.  In addition, greater residual soil moisture associated with the flooded area when a late-season drought occurred was probably responsible for the greater yield.  After 6 days of flooding, yield losses ranged from 0% at two sites to about 60% at a third site and over 90% at another site.  At one of the sites with no yield loss, the subsoil had a high sand content, which enable the root zone to quickly return to aerated conditions.

In another study, researchers found that flood irrigation for greater than 2 days reduced soybean yield by 20% as compared to a 1-day flood treatment.

What to Do After the Flood.  While it may seem that there is little to do to help a flooded crop, it is very important that we minimize any other stress on the crop that can prevent recovery.  First, try to stay off of the field.  Wet fields compact easily.  Compaction will further stress the crop and slow its recovery.  Make sure that the field is dry enough before taking equipment back on it.

Evaluate the stand.  If a stand reduction occurred, determine if it’s worthwhile to replant.  Remember that after mid-June, every day delay in planting will cost you about ½ of a bushel in yield.  The plants that remain are still higher yielding than seed that can now be planted, even if the stand has been substantially reduced.

Stress such as herbicide injury can slow the crop down further.  Still, weeds need controlling.  But you may want to select herbicides (usually as tank-mix partners to glyphosate) that don’t cause a significant amount of burning.

Cultivation is an option to conventionally tilled fields to help aerate the soil.  However, cultivating a wet soil can do more damage than good by causing additional compaction, which in turn would further stress the crop.

You may also want to dig a few roots and inspect for adequate nodulation.  Make sure the nodules are pink.  I see little that can be done, but knowing that the nodules are still working may give you peace of mind.  And while you’re doing that, split some stems and roots to check for any disease.  If suspected, send in to one of our Plant Disease Clinics to be further evaluated.

Finally, some will want to apply some type of foliar fertilizer to the crop to “kick-start” it back to health.  But, I see little advantage of this.  Remember that the real problem is lack of O2 to the roots and CO2 buildup in the soil; only after the roots begin to receive O2 will the recovery process start.

Hopefully you haven’t experienced severe flooding (> 24 hours).  But if so, be patient and evaluate the field.  Then make good decisions on how to handle it.


Kudzu bugs now found infesting soybean fields in Virginia

Ames Herbert, Extension Entomologist
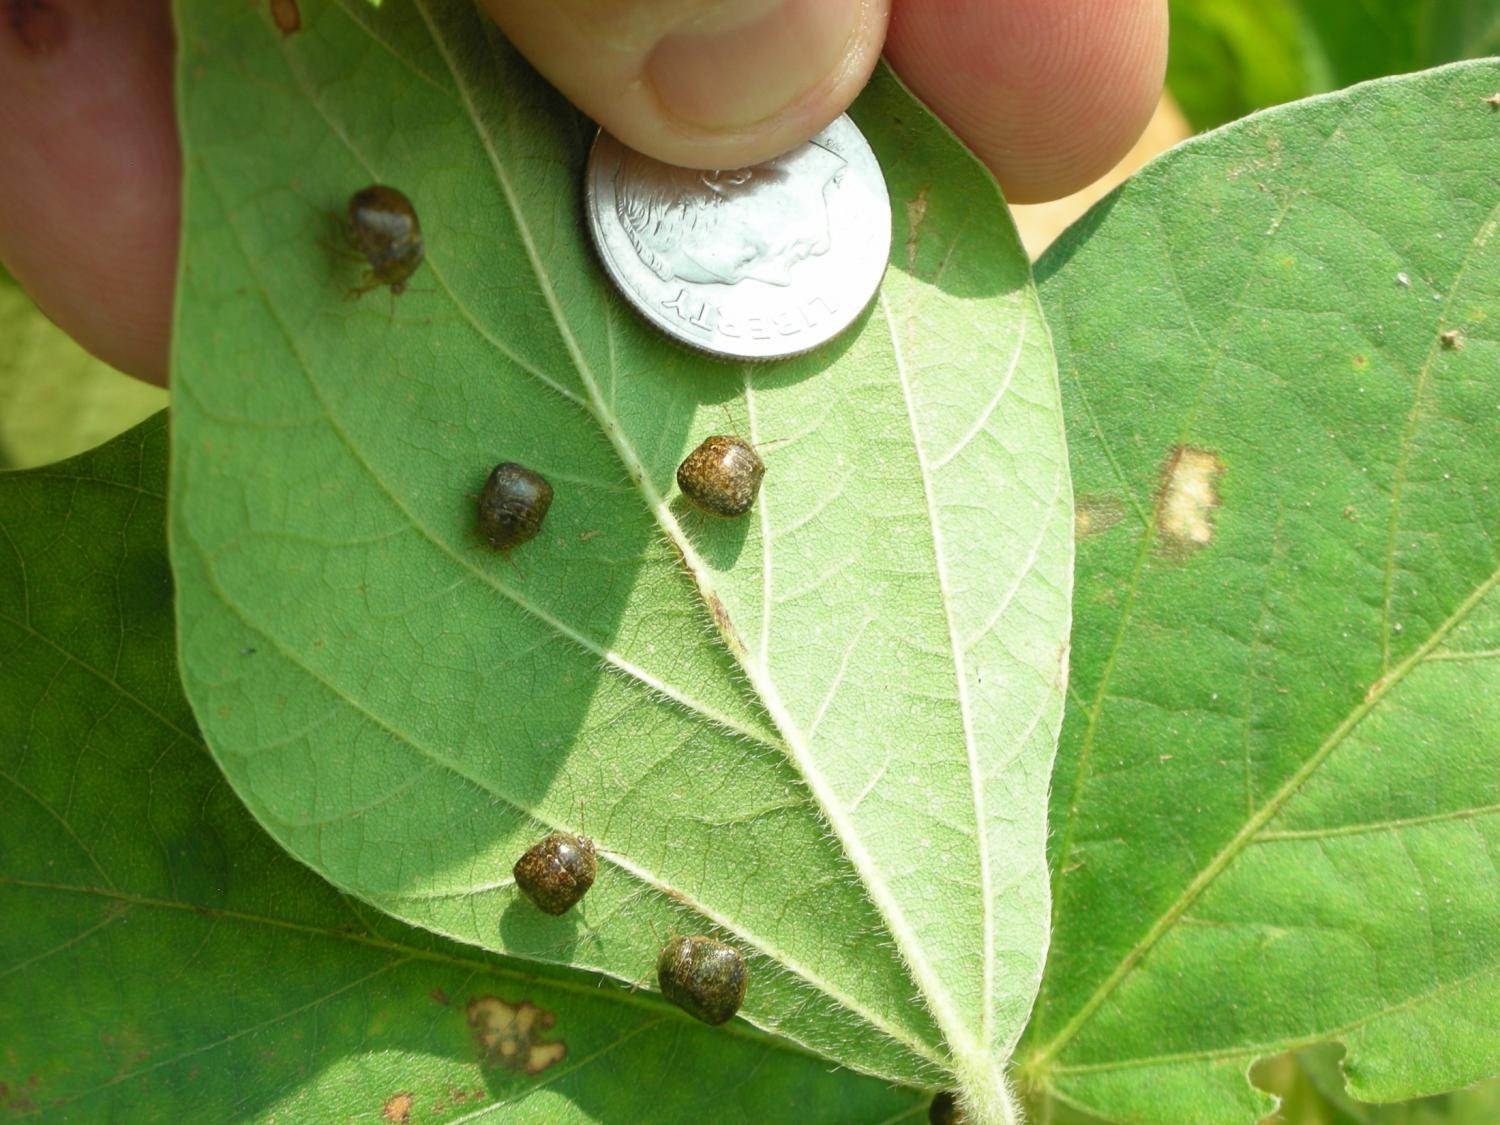
The kudzu bug situation has very quickly become a real problem for Virginia soybean producers. We are getting reports of infestations in the South Boston area and one from near Yale in Sussex County. I am quite sure that there are more infested fields. The image sent to me from the Yale field showed at least a dozen KB adults on a single plant. WHAT IS THE THRESHOLD and WHEN SHOULD YOU TREAT??? The treatment threshold for full grown R-stage plants has not changed (see below), but I have new information on thresholds for seedling/vegetative stage plants. Based on an experiment in GA, they (and others) are recommending treating at V2-V3 stage at an average of 5 bugs (adults and/or nymphs) per plant. The threshold increases to 10 bugs per plant for plants from 1-2 feet tall. The established threshold of one nymph per sweep (one swoosh of the net) should be used for plants above 2 feet tall. Kudzu Bug 2Plants should be sampled at least 50 feet from the edge of the field. The reason for this is that the adults have an extended migration period (6-8 weeks) and colonize field edges first. If you sample the edges, chances are you will make a spray decision too soon before the migration is over. They stress that these thresholds are PRELIMINARY and will absolutely change as we get more information. Here is a cautionary tale provided by Dr. Reisig at NCSU. A NC grower noticed kudzu bugs on the edge of his April-planted beans in May 2012. They had not yet infested the interior portions of the field. He opted to spray. He then had to spray again in June, as the adults remigrated into the field. Additionally, sprays don’t kill eggs, so these hatched into nymphs. The grower then had to spray a 3rd time in June, as spider mites were flared in the field from the lack of beneficial insects. We want to avoid these costly situations while still preserving our yield.

Will Slugs Be A Problem in 2013?

Slugs are not a new problem, but they continue to be an unpredictable one.  It seems that they show up when and where we least expect them and never show up when and where we do.  But considering the cool and wet weather we’re experiencing, we should be on the watch.

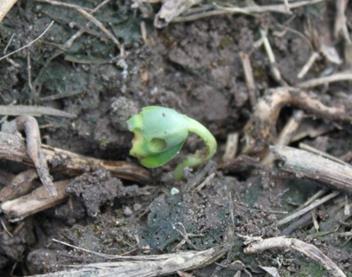
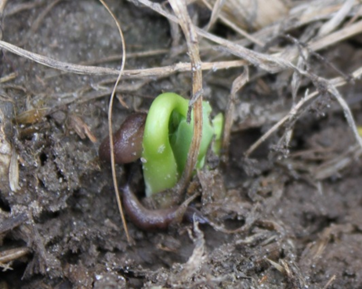
The photo below was taken last May, 5 days after planting in a no-till field with a rye cover crop.  Stand was about half of what was expected and feeding scars could be seen on the hypocotyl and cotyledons.  When digging in the seed furrow, slugs were more often present than not.

Slug Damage Soybean

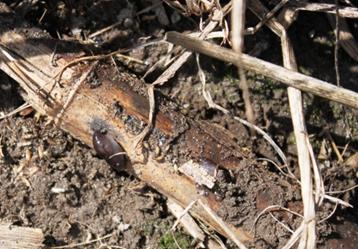
Cold, wet weather slows seedling growth; therefore reducing the plant’s ability to outgrow slug damage.  Slugs will feed on all crops, taking large chunks out of the stem and sometimes cutting the plants like a cutworm.  They feed mostly at night although I’ve seen them feeding during cloudy days (see photo below).  In general, they are more of a problem in wet, poorly drained fields or in low-lying portions of fields.  Still, we’ve seen them on hilltops.  Slug on SoybeanThey are usually a problem in no-till fields with high residue crops such as corn or grain sorghum and/or in fields the slug underneath last year’s corn stalk.  If the seed furrow doesn’t fully close, slugs will follow this “highway” and eat seedling after seedling before it emerges from the soil.

Slug Under corn residueWhat can be done about this problem?  First, scout the field before you plant, paying close attention to poorly drained or low-lying portions of the field.  If you find slugs, you have a couple of options.  One is to not plant and wait for warmer and dryer weather.  Slug damage usually disappears under warm and dry conditions.

Another alternative is to apply the slug bait/molluscicide, Deadline®, which contains the active ingredient metaldehyde.  It is sold at Deadline® M-Ps™ Mini-Pellets (colored with a blue dye) and Deadline® Bullets (dye-free).  This is the only reliable treatment that we have available.  It must be spread evenly at 10 to 40 lbs per acre over the infested area.  The product is fairly expensive, so the 10 lb rate is the most common and has worked well in my experience.  The product is not commonly stocked by local retailers, so it can be hard to find.

Will slugs be a problem?  Maybe.  Maybe not.  But, with the current weather conditions, I’d suggest scouting those slug-prone fields.

Full-Season Soybean Seeding Rates

My soybean seeding rate recommendation for full-season production systems is to plant enough seed to insure 80,000 uniformly spaced plants/acre.  If you cannot uniformly space the plants within a row, then my recommendation rises to 100,000 plants/acre.  Based on numerous seeding rate experiments conducted in Virginia, I feel very confident in this recommendation.

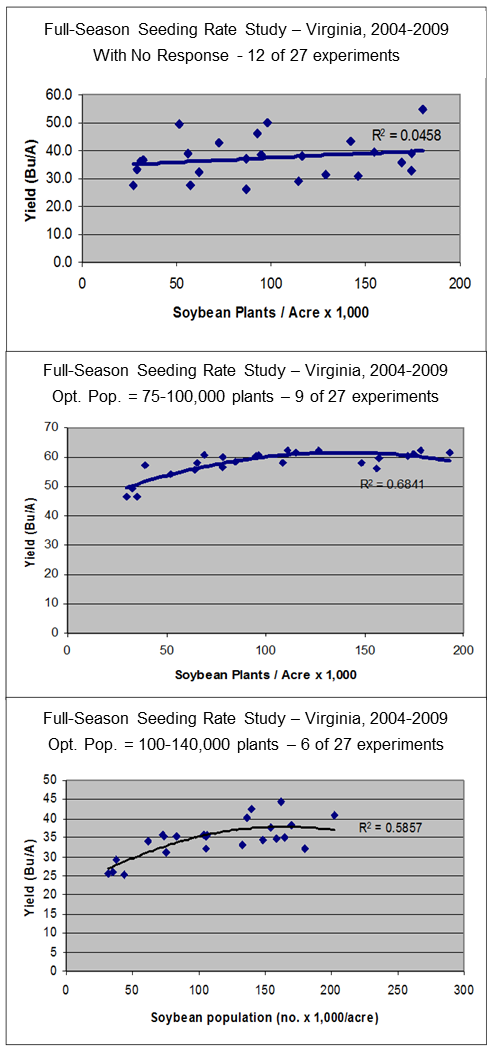
Of the 27 full-season seeding rate experiments conducted from 2004 to 2009, I can group soybean yield response to plant population into the following three categories: 1) no response to plant population; 2) optimum plant population of 75-100,000 plants/acre; and 3) optimum plant population of 100-140,000 plants/acre.  Below are individual tests that represent these categories.

Full-Season Seeding Rate Study - Virginia

First, note that these examples only show the response of yield to plant population and do not take into account seed costs.  When seed costs are included, the optimum plant population is lower than is shown on the graphs.  Also note that these graphs show yield response to plant population, not seeding rate.  To convert to seeding rate, adjust these numbers to reflect your expected percent emergence.  For example if you assume 75% emergence, you would need to adjust your seeding rate to 133,000 seed/acre to obtain 100,000 plants/acre.

We conducted these experiments with maturity group 4 and 5 varieties.  While one may think that more seed might be required for early-maturing varieties, this was not the case (i.e., group 4 and 5 varieties responded similarly).

There may be some correlation with yield potential as listed below:

  • 30-40 Bu/A Yield Potential (14 tests)
    • 6 required 100-130,000 plants/acre
    • 2 required 70-100,000 plants/acre
    • 6 had no yield response
  • 40-60 Bu/A Yield Potential (7 tests)
    • 2 required 70-100,000 plants/acre
    • 5 had no yield response
  • > 60 Bu/A Yield Potential (7 tests)
    • 2 required ~130,000 plants/acre
    • 4 required 70-100,000 plants/acre
    • 1 had no yield response

So, what do these data mean?  It means that every environment (year & location) is a little different and there is no way that we can predict with 100% accuracy the exact seeding rate that will be required for your field in the coming growing season.  However, we do know that if we can obtain full canopy closure (90-95% light interception) by full flower (R2 stage) to early pod (R3 stage), we can maximize soybean yield potential.  In a dry year or under a droughty soil (low yield potentials), greater seeding rates will help insure this.  Still in most cases (30 to 60 bushel yield potentials), 70-100,000 plants/acre are adequate.

What about fields with greater than 60 bushel yield potential?  In this case, we need to look beyond adequate leaf area and need to start thinking about how many pods the soybean plant can support.  For instance, at 40 bushels/acre and 100,000 plants/acre, we only need to produce 72 seed/plant (using 3000 seed/lb) or about 30 pods/plant (using 2.5 seed/pod).  But, at 60 bushels/acre, we need to produce 108 seed or 45 pods per plant; at 80 bushels/acre, we need 144 seed or 60 pods per plant.  Considering that 12 reproductive nodes per plant are possible, 4 to 5 pods per node on a rather tall plant would be required.  Although branching will also contribute to yield, that seems a lot to ask of one soybean plant.  So, if you are trying to win the yield contest or are irrigating soybean, I suggest planting enough seed to obtain 120-140,000 plants per acre in a full-season system; otherwise 80-100,000 plants are adequate.

Cool Soils Should Alter Your Planting Plans

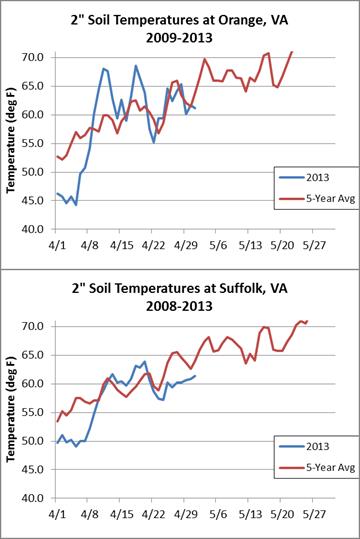
It goes without saying that every year is different and this winter/spring has been wet and cold. I think that most of us have assumed that the soil temperatures are much below normal; therefore, holding off a few days with planting may be a good idea.  According to 2013 and five-year historical soil temperature records at Orange and Suffolk (from the USDA-NRCS Soil Climate Analysis Network weather stations), soil temperatures have been fluctuating quite a bit.Virginia Soil Temps 2013

After early-April soil temperatures proved to be much colder than normal, a week or two of warm weather put us back on track with average.  Then, temperatures dropped off again.  Fortunately, the last two weeks of cool weather have not lowered the soil temperatures all that much.

Although our soils have warmed substantially since early April, the temperatures are still less than optimum for soybean germination and emergence.  Ideally, I like to see temperatures hold steady at 65 to 70O or above.  The ideal temperature for soybean germination is 77O and the optimum range is 68 to 86O.  The maximum is 94O, where germination can be inhibited.  However, we can’t always wait for perfect temperatures if we are to get all of our soybeans planted on time.

Still, planting soybean in cool (<65O) will lead to delayed emergence and increased chance of seedling disease that can reduce stands, weaken emerged plants, and inhibit early-season growth.  For a more detailed description of fungal seedling disease in soybean, refer to an article I wrote last May on the subject and can be found in my Virginia Soybean Update blog.

I stress that the greater time required for emergence, the greater probability that the seed will become infected with soil-borne disease.  If you are planting into cool soils, I strongly suggest using fungicide-treated seed as an insurance against seedling disease. These treatments will protect the seed and seedling if emergence is delayed.

But, seed treatments should not be a substitute for other practices that encourage rapid seedling emergence.  Here is my checklist for insuring a good stand free of seedling disease:

  • Know the germination and vigor of your seed; adjust the seeding rate accordingly.
  • Insure good soil-to-seed contact by properly setting your planter to cut through the residue and penetrate to the proper depth.
  • Plant soybean seed ¾ to 1 inch deep into good soil moisture.
  • Consider fungicide seed treatments if planting into cool soils.

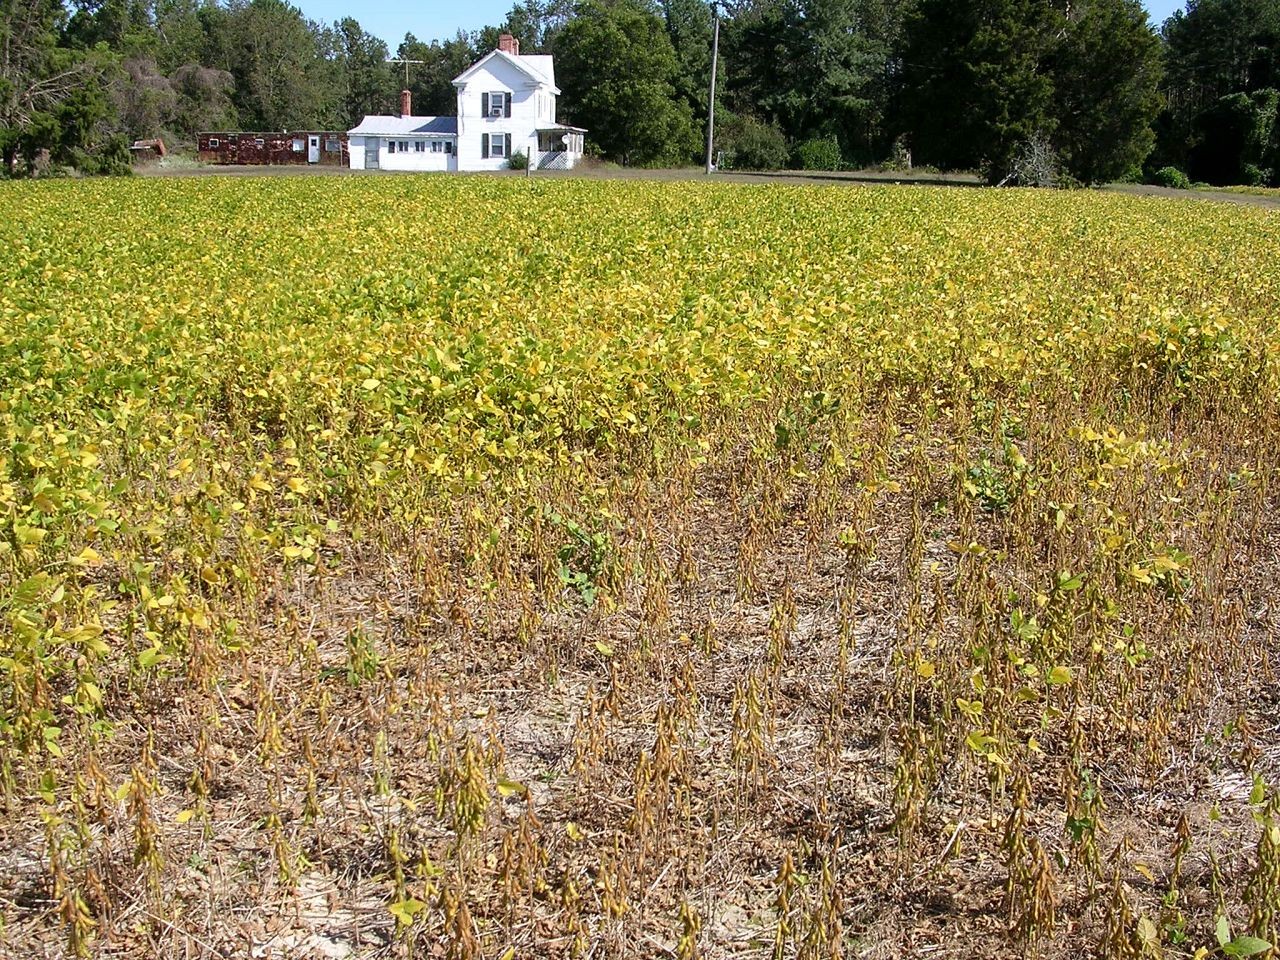
It’s Time to Sample for Nematodes

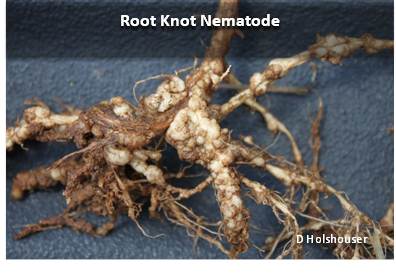
Nematodes are unsegmented roundworms, some of which feed in or on roots of plants.  More than 100 species of plant-parasitic nematodes feed on soybean roots, but only a few are economically important.  In Virginia, most nematode species are found in the sandier Coastal Plain soils.  However, some nematode species can also develop and reproduce on the heavier-textured soils of the Piedmont and Shenandoah Valley.  This guide will focus on those that can cause damage to soybean in Virginia.

Many soybean growers do not realize that nematodes may be reducing yields by 7-8%.  Therefore management of these pests begins with sampling and determination of the species and number present.  If nematodes are determined to be a threat, certain management practices are available to help prevent further spread and reduce the economic losses that they cause.

During 2007-2010, over 1000 soil samples were taken and analyzed for nematodes in problematic corn and soybean fields in eastern Virginia.  These fields were not chosen at random, but were selected because of low productivity or were showing symptoms that were typical of nematode damage.  Of the “problem” soybean fields, 98% contained nematodes and 71% of the fields were at moderate to high risk of nematodes causing a significant yield loss.

Sampling and Thresholds.  Virginia Tech’s Nematode Advisory Program depends on the cooperation of the agricultural community, Extension Agents, and the Nematode Assay Laboratory. Proper sampling, completion of appropriate forms, and careful laboratory analysis are all necessary to provide the grower with appropriate recommendations on nematode management. The Nematode Advisory Program can help growers avoid costly yield loss due to plant-parasitic nematodes if the steps outlined below are followed.

The Virginia Tech Nematode Assay Laboratory currently performs assays for two different purposes:

  1. Predictive: The predictive assay determines if nematode populations at harvest are likely to affect next year’s crop.  There is a fee for predictive samples.  Routine assays are $11 per sample and routine plus cysts are $19 per sample.
  2. Diagnostic: The diagnostic assay determines if poor growth in the current year’s crop is caused by nematodes.  There is no fee for diagnostic samples.

When to Sample.  The most appropriate time to sample depends on the crop and the purpose of the sample.

Predictive Assays: Fall sampling provides the most reliable information for predicting nematode problems for a future crop. Nematode populations are highest at the end of the growing season and decline as the soil temperatures drop.  Sample at or immediately after harvest of previous crop, September 15 to November 15.

Diagnostic Assays: Sample at the onset of symptoms, during the growing season. Nematodes feed only on living plants; therefore, sample soil around live plants showing symptoms. Some nematodes spend part of their life cycle inside the roots and more accurate diagnosis of nematode damage can be made from samples including roots.  Also, send another sample from a healthy plant to compare population densities.

How to Sample.  Always sample within the feeder-root zone; this varies for each crop. Avoid collecting samples when the soil is extremely dry or extremely wet. DO NOT add water to the soil after sampling. Sample areas of common crop history. For example, if one half of the field is planted to corn and the other half to soybean, sample each area separately.

  1. Collect vertical core subsamples of soil with a soil sampling core or shovel within the feeder-root zone (see figure at right). A 6″ depth should be adequate. Nematodes do not occur uniformly throughout a field; thus, more than one subsample must be taken from the same field. The number of subsamples needed depends on the size of the field:
    1. For small fields (less than four acres), collect at least 20 subsamples.
    2. For large fields (more than four acres), divide the field into four-acre sections. If the field consists of several soil types, divide the field into as many sections as there are soil types. Collect at least 20 subsamples from each section.
  2. Mix the subsamples in a clean bucket.
  3. Place at least one pint (500 cc) of the soil mixture into a nematode soil sample bag or plastic bag. LABEL COMPLETELY with the grower’s name, address, county, agent, crop information, and field or sample number.
  4. Complete the appropriate form to send with the samples. The forms are available at Virginia Cooperative Extension offices at no charge.  Soil sample bags may be available at these offices, as well, however quart-size, sealable, plastic bags are also suitable.
  5. Store samples in a cooler or refrigerator until shipping.  It is best to ship samples on Monday or Tuesday to avoid them sitting in a hot mailroom or truck.
  6. Mail samples with the appropriate form, and a check for predictive assays, immediately to the Nematode Assay Laboratory, 115 Price Hall , Virginia Tech, Blacksburg, VA 24061-0331

Interpreting Predictive Assays.  Predictive nematode sampling use nematode risk thresholds to determine whether to take action against nematodes.  These thresholds are based on results of on-farm tests over several locations and years.  The table below lists three levels of risk for yield loss according to population densities in a 500 cc sample of soil.  Risk thresholds apply to soil samples collect in late summer or early fall.  Soil samples collected during winter or spring always contain reduced levels of nematodes due to unfavorable temperatures and the absence of a host crop.  Note that if more than one nematode is present at the borderline level, the likelihood of a profitable response to a control measure increases.

Nematode Risk Thresholds for Soybean (per 500 cm3 soil)

Risk Level

Nematode

Low

Moderate

High

Soybean Cyst larvae

0-20

20-60

>60

cysts

0

>1

Lance

0-300

300-1000

>1000

Lesion

0-100

100-500

>500

Ring

0-200

200-700

>700

Root Knot

0-50

50-170

>170

Spiral

0-1000

>1000

Sting

0-10

10-20

>20

Stubby Root

0-90

>90

Stunt

0-300

300-1000

>1000

Recommendation Codes:Low = nematodes are no likely to cause crop damageModerate = borderline populations in which crop damage may occur if other factors stress the cropHigh = populations are likely to cause crop damage and significant yield loss

For more information on soybean nematodes and their management, see the VCE publication AREC-9, Soybean Nematode Management Guide.  You can access the guide on the web at http://pubs.ext.vt.edu/ or obtain a hard copy at your County Extension office.


Now is a Good Time to Evaluate Your Varieties for Foliar Diseases

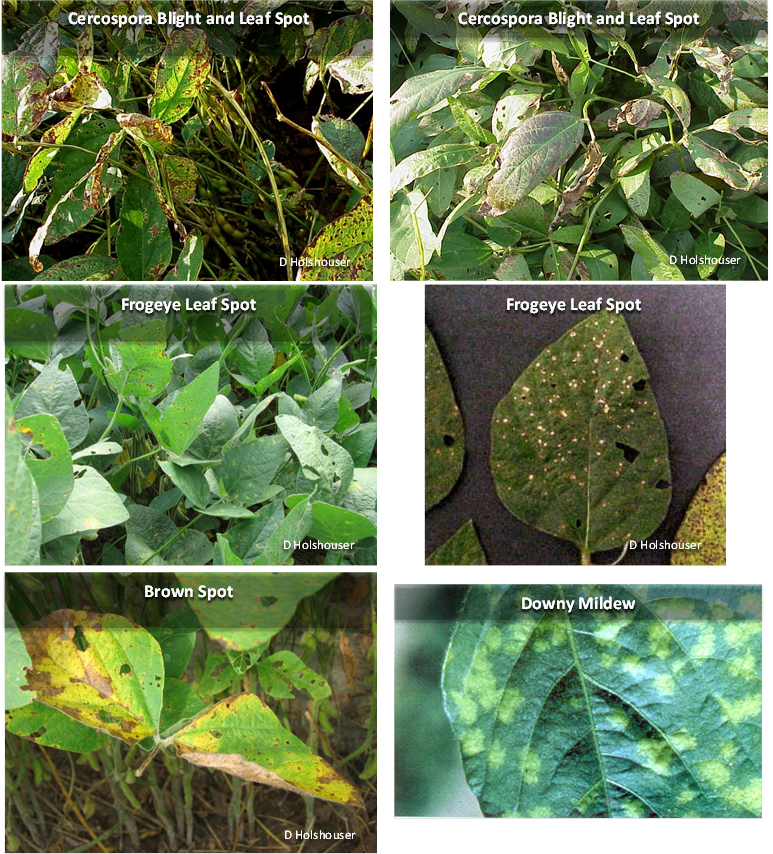
September is a great time to evaluate your crop and the performance of varieties that you chose.  In addition to general growth and health of the crop, take some time to determine if you have any of the below diseases.  If so, you could be losing some yield.  If you sprayed with a fungicide and still have disease, reconsider the product and rate used and the time that the fungicide was applied.  Keep in mind the weather conditions when the application was made and the conditions 2 to 3 weeks after or before the product was applied.  Cool temperatures (70’s) and high relative humidity (>95% for 12 hours or more) will usually increase disease incidence.

Another caution is to never diagnose a specific disease on the plant without verifying it with a person trained to identify plant pathogens.  Only when the reproductive structures are found on the leaf can a disease be confirmed.  Many things will cause look-alike symptoms.  Be sure before you cast the blame.  There are more diseases than just the ones shown below, but these are the most common.  Brown spot is normally found in the lower part of the crop canopy (the lower leaves), Cercospora blight and leaf spot will be found throughout the canopy, and the frogeye leaf spot and downy mildew tend to be found in the upper part of the canopy.